Fig. 7
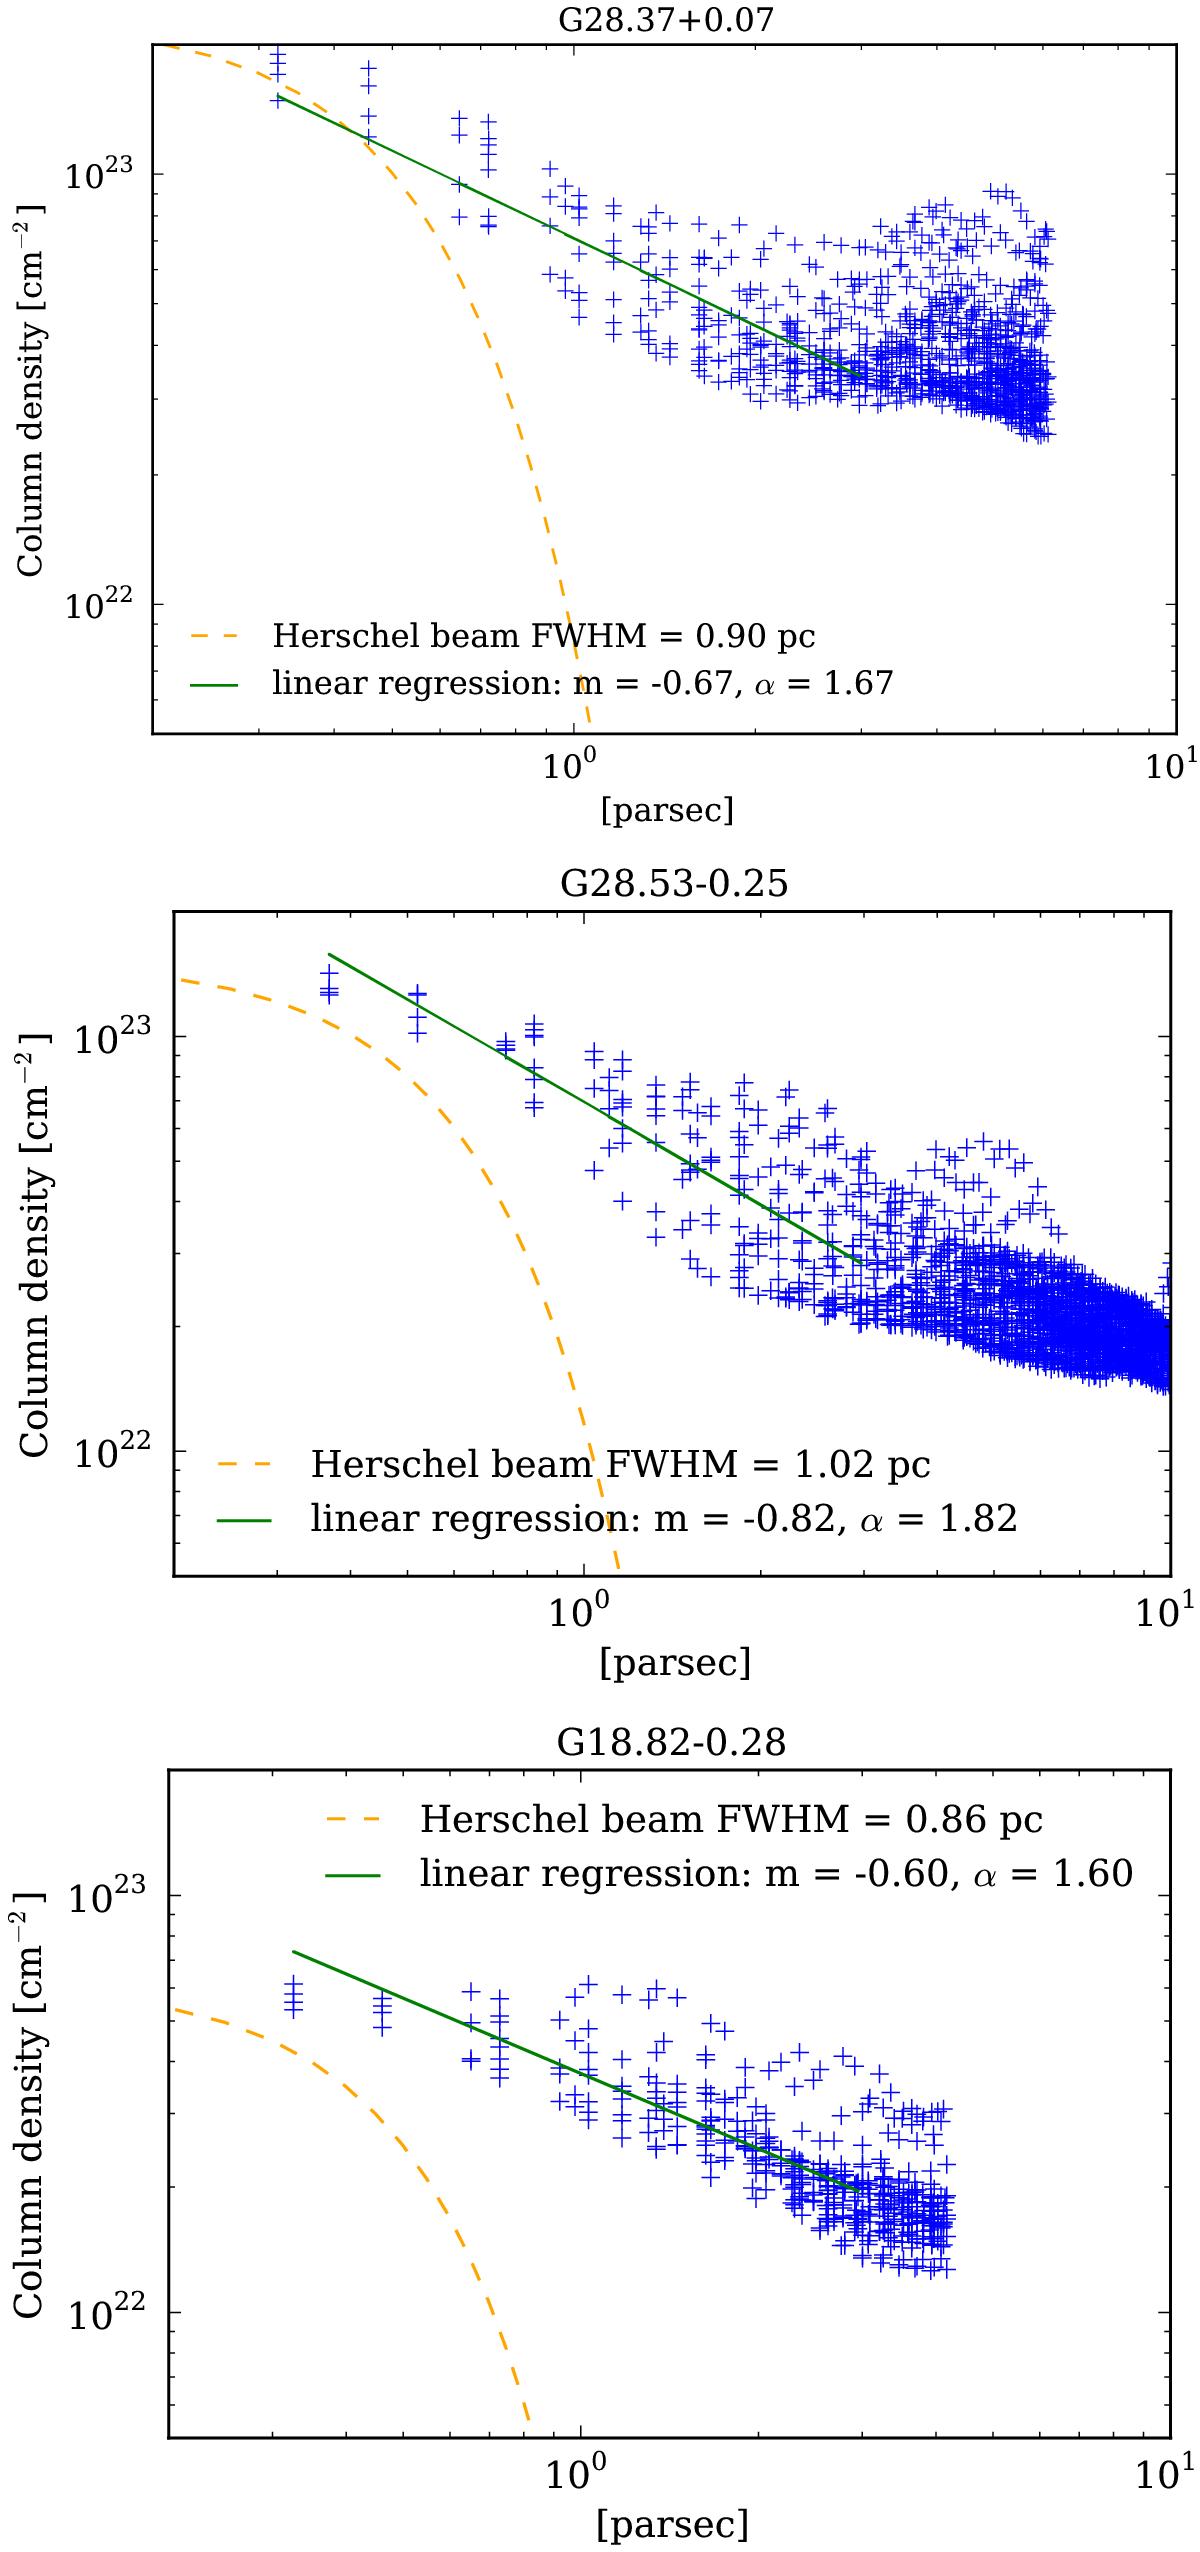
Radial column density profile for G28.37+0.07, G28.53-0.25, and G18.82-0.28. Each cross in the panels represents one pixel value in the map. The x-axis gives the distance to the centre of the ellipse (x-axis). The dashed orange line indicates the Herschel beam (Gaussian profile with a FWHM of 36′′ displayed in log-log format). The exponent α was deduced from fitting the column density profile (N ∝ r1−α). For the fit, we included only the pixels that were inside a radius of 3 pc.
Current usage metrics show cumulative count of Article Views (full-text article views including HTML views, PDF and ePub downloads, according to the available data) and Abstracts Views on Vision4Press platform.
Data correspond to usage on the plateform after 2015. The current usage metrics is available 48-96 hours after online publication and is updated daily on week days.
Initial download of the metrics may take a while.