Fig. 5
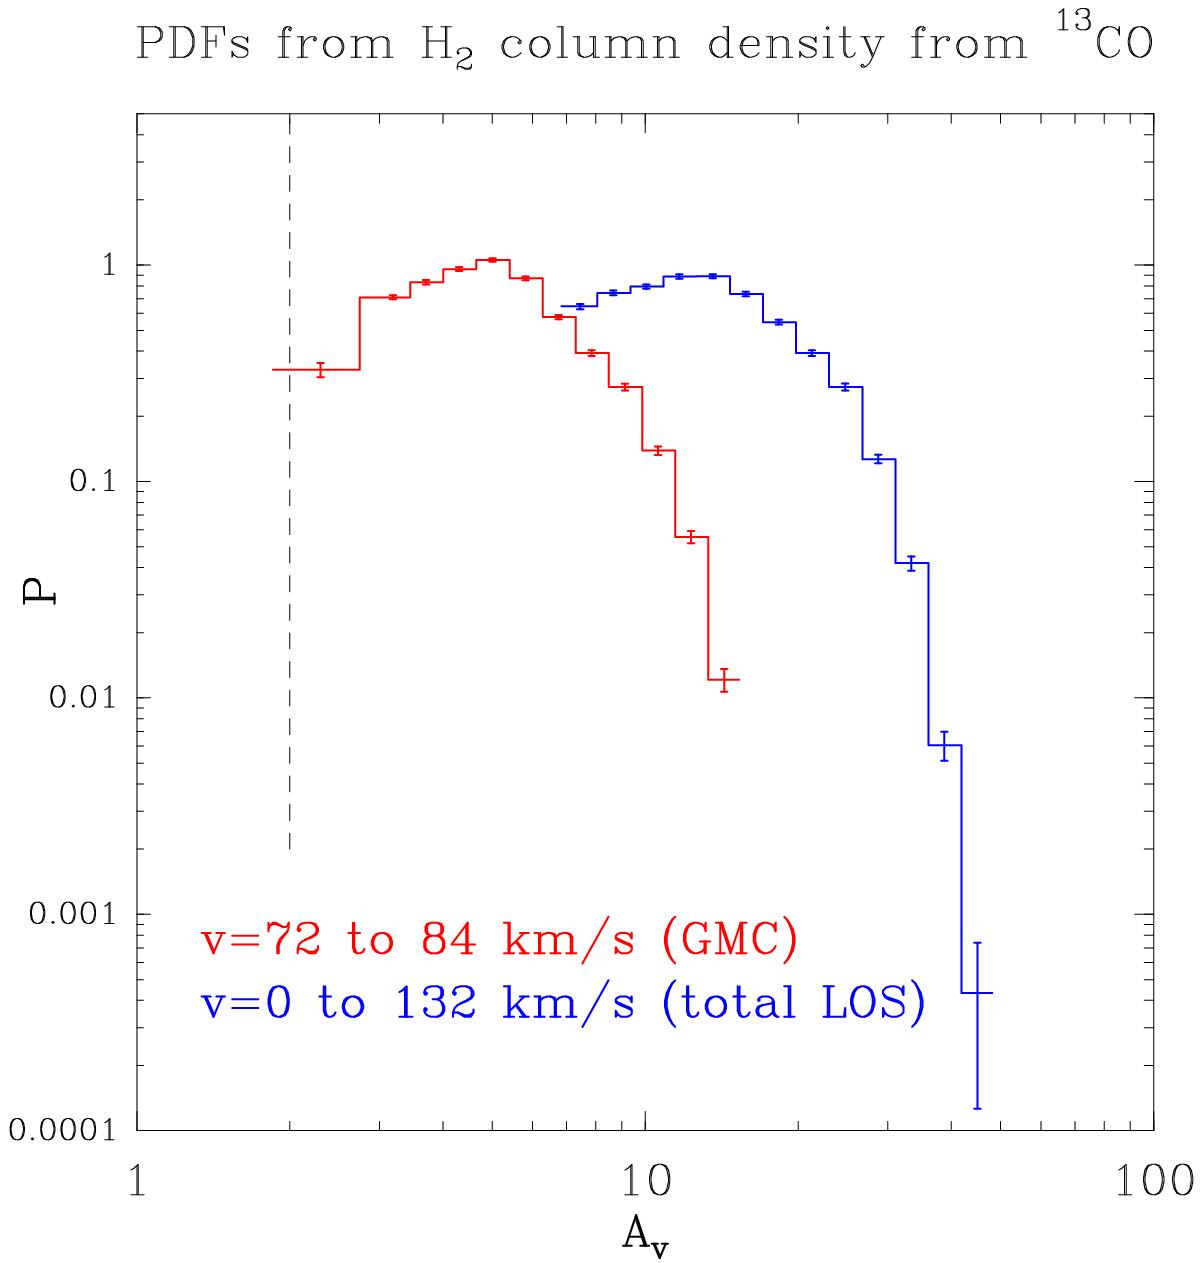
PDFs of the whole GMC including G28.37+0.07, obtained from H2 column density maps derived from 13CO emission. The blue PDF contains all emission along the line-of-sight (LOS) towards the GMC (v = 0 to 132 km s-1); the red PDF contains only emission coming from the bulk emission of the cloud (v = 72 to 84 km s-1). The long dashed line is the Av = 2 level outlining the GMC.
Current usage metrics show cumulative count of Article Views (full-text article views including HTML views, PDF and ePub downloads, according to the available data) and Abstracts Views on Vision4Press platform.
Data correspond to usage on the plateform after 2015. The current usage metrics is available 48-96 hours after online publication and is updated daily on week days.
Initial download of the metrics may take a while.