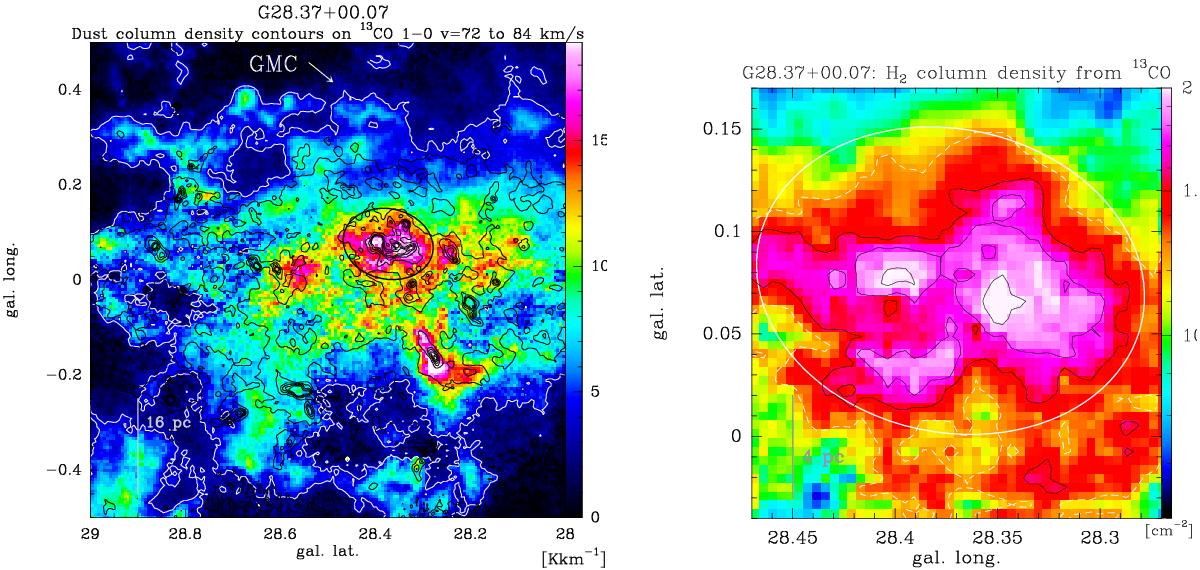
Fig. 3

Left: line integrated 13CO 1→0 emission in colour scale between v = 72 and 84 km s-1, the velocity range of the bulk emission of the IRDC, and the associated GMC. The white contour indicates the 3.5 K kms-1 level, corresponding to Av = 2, which defines the extent of the GMC and was used for mass estimation. The Herschel column density is overlaid as black contours (levels 2 to 6 × 1022 cm-2 in steps of 1022 cm-2) and the IRDC is outlined by an ellipse (Simon et al. 2006b). Right: H2-column density map of the centre region of the GMC, obtained from 13CO 1→0. The white-dashed contour indicates a column density of 1.25 × 1022 cm-2, the remaining black contours the levels 1.5, 1.75, and 2 × 1022 cm-2.
Current usage metrics show cumulative count of Article Views (full-text article views including HTML views, PDF and ePub downloads, according to the available data) and Abstracts Views on Vision4Press platform.
Data correspond to usage on the plateform after 2015. The current usage metrics is available 48-96 hours after online publication and is updated daily on week days.
Initial download of the metrics may take a while.


