Fig. 2
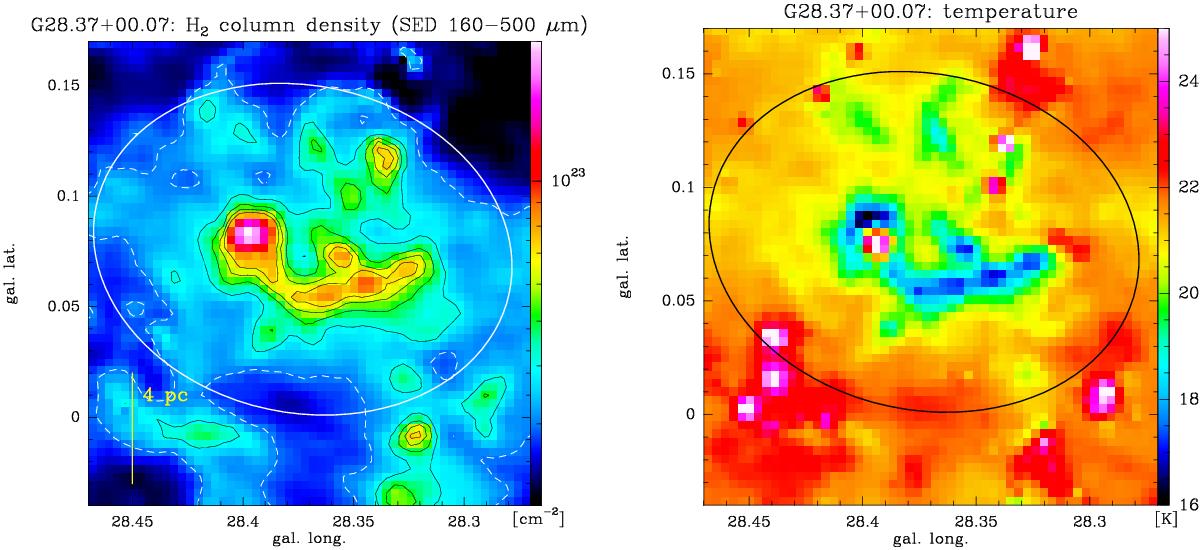
Left: H2-column density map from an SED fit to Herschel fluxes at 160−500 μm. The black contours indicate the levels Ndust = 4 to 7 × 1022 cm-2 in steps of 1022 cm-2, the white-dashed contour outlines the approximate completeness level (~3 × 1022 cm-2), and the white ellipse is taken from Simon et al. (2006b), defining the IRDC. Right: temperature map of G28.37+0.07.
Current usage metrics show cumulative count of Article Views (full-text article views including HTML views, PDF and ePub downloads, according to the available data) and Abstracts Views on Vision4Press platform.
Data correspond to usage on the plateform after 2015. The current usage metrics is available 48-96 hours after online publication and is updated daily on week days.
Initial download of the metrics may take a while.