Fig. 6
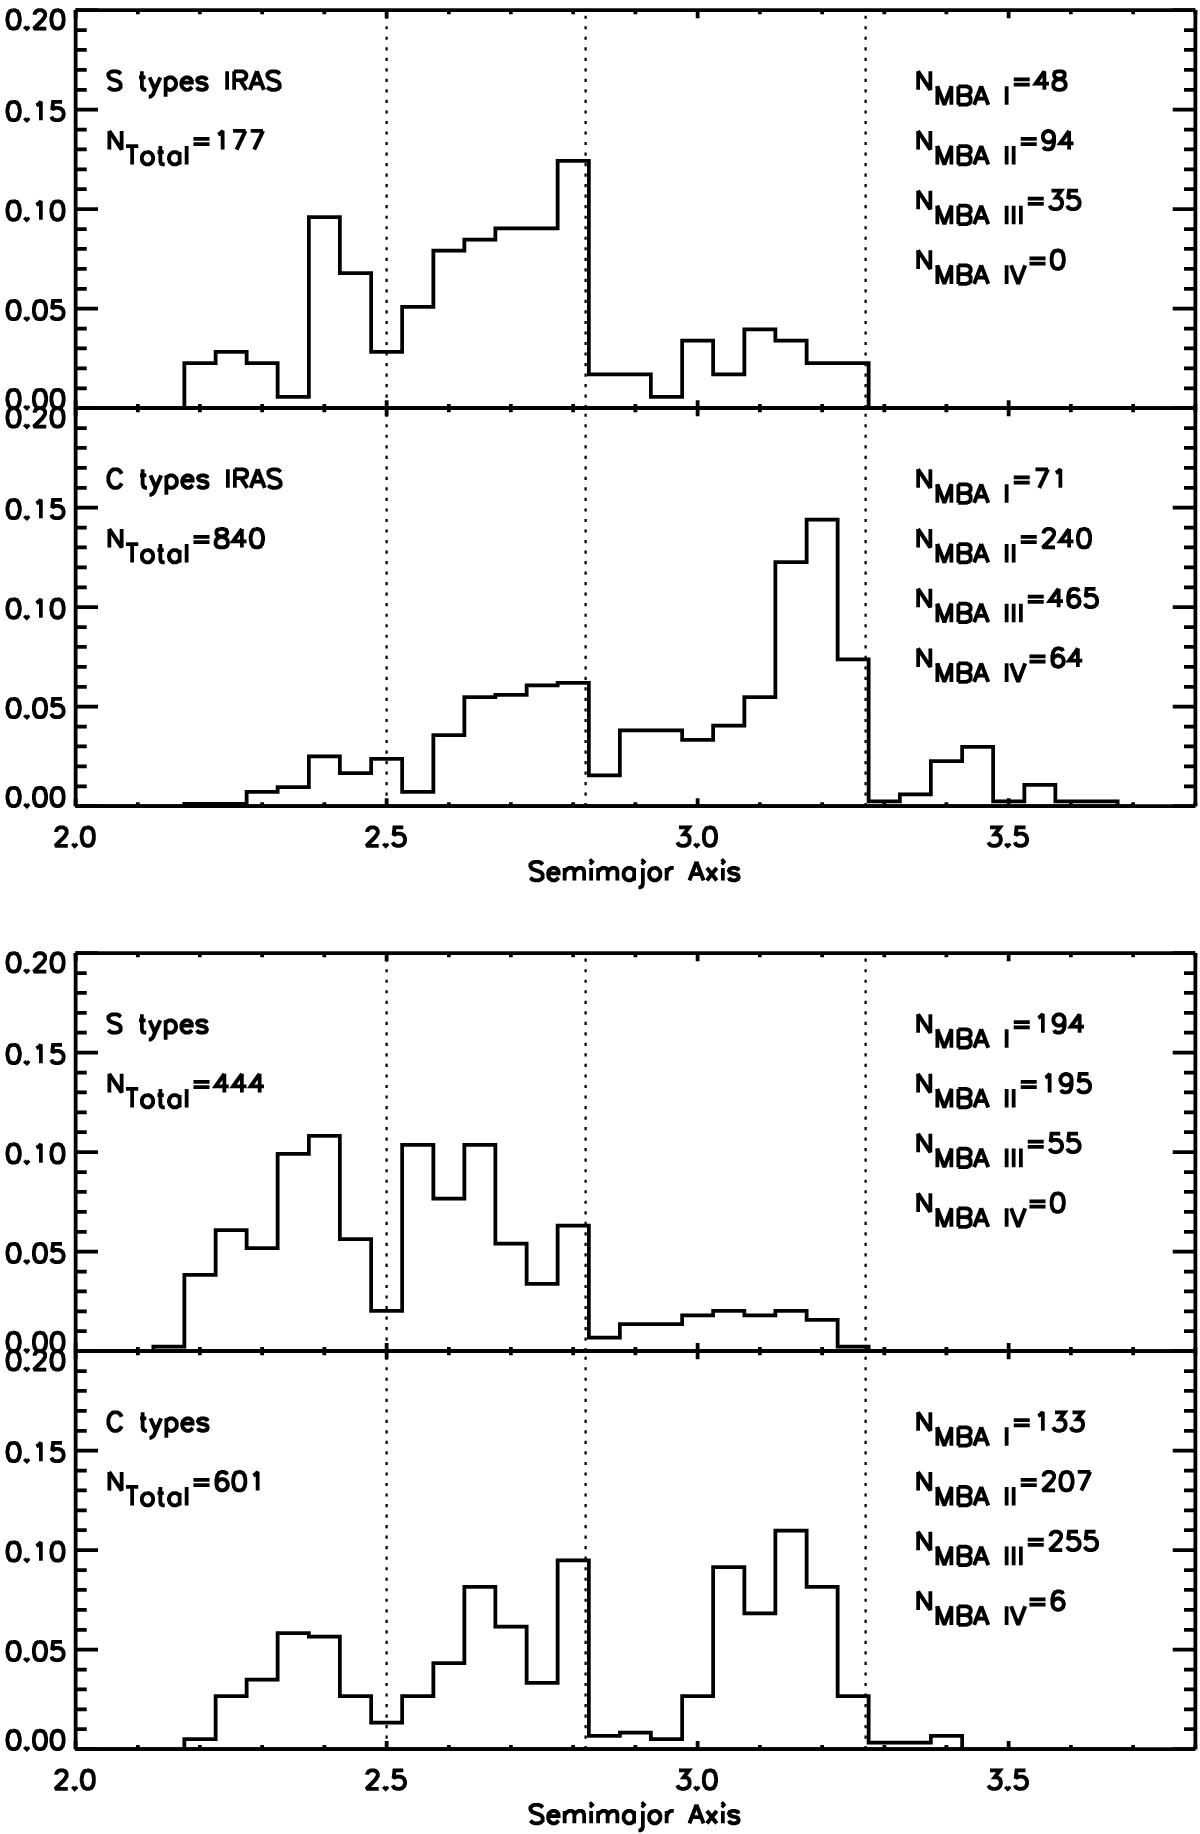
Heliocentric distance distribution of C- and S-type asteroids with all family members removed from the IRAS and MSX surveys (top panel, and Spitzer surveys on the bottom. The y-axis is the total percent of the taxonomic type in each bin of width 0.05 AU – addition of all y-values will equal 1.0. Dashed lines mark the edges of the (Zellner et al. 1975) Main Belt regions, and values on the right of each plot give the number of asteroids of specified taxonomic type in each Main Belt region. The distribution of the low albedo small and large asteroids is interesting; only 9% of all large (D> 10 km) asteroids with C-type albedos are found in the inner Main Belt, but 24% of all small (D< 10 km) asteroids with C-type albedos are found in the inner Main Belt.
Current usage metrics show cumulative count of Article Views (full-text article views including HTML views, PDF and ePub downloads, according to the available data) and Abstracts Views on Vision4Press platform.
Data correspond to usage on the plateform after 2015. The current usage metrics is available 48-96 hours after online publication and is updated daily on week days.
Initial download of the metrics may take a while.