Fig. 2
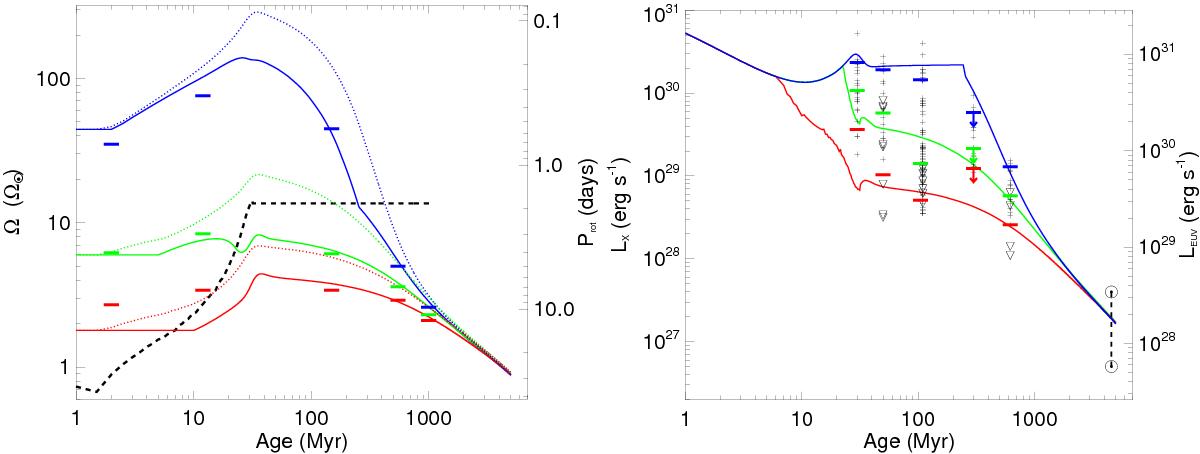
Left: predicted rotational evolution tracks for stars at the 10th (red), 50th (green), and 90th (blue) percentiles of the rotational distribution. The solid and dotted lines show the envelope and core rotational evolution, respectively, and the horizontal solid lines show the observational constraints on the percentiles. The dashed black line shows the time dependent saturation threshold for Ṁ, Bdip, and LX calculated assuming a constant saturation Ro and the τ⋆ values of Spada et al. (2013). Right: predicted LX along each of our rotation tracks and comparisons to observed LX values of single stars in several clusters with upper limits shown by ▽ symbols. The solid horizontal lines show the 10th, 50th, and 90th percentiles of the observed distributions of LX at each age calculated by counting upper limits as detections. The two solar symbols at 4.5 Gyr show the range of LX for the Sun over the course of the solar cycle. The scale on the right y-axis shows the associated LEUV.
Current usage metrics show cumulative count of Article Views (full-text article views including HTML views, PDF and ePub downloads, according to the available data) and Abstracts Views on Vision4Press platform.
Data correspond to usage on the plateform after 2015. The current usage metrics is available 48-96 hours after online publication and is updated daily on week days.
Initial download of the metrics may take a while.