Fig. 1
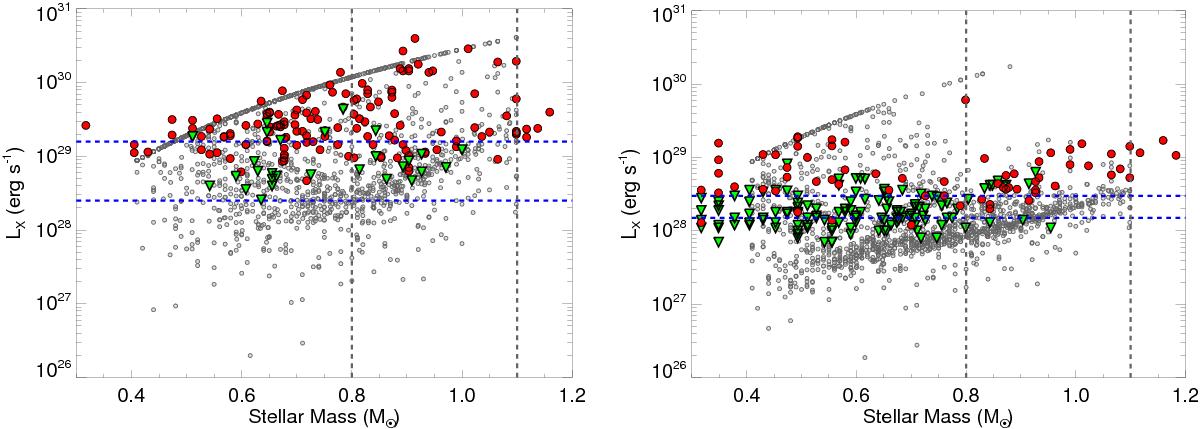
Comparisons between observed and predicted distributions of LX at ages of 150 Myr (left) and 620 Myr (right). The grey symbols show predicted distributions calculated using Eq. (1) and the distributions of rotation rates derived by Johnstone et al. (2015). The red circles and green triangles show detections and upper limits for stars in the Pleiades (left) and Hyades (right). The horizontal blue lines show detection thresholds. The upper line of stars in the theoretical distributions is caused by the stars whose rotation rates lie above the mass dependent saturation threshold.
Current usage metrics show cumulative count of Article Views (full-text article views including HTML views, PDF and ePub downloads, according to the available data) and Abstracts Views on Vision4Press platform.
Data correspond to usage on the plateform after 2015. The current usage metrics is available 48-96 hours after online publication and is updated daily on week days.
Initial download of the metrics may take a while.