Fig. 2
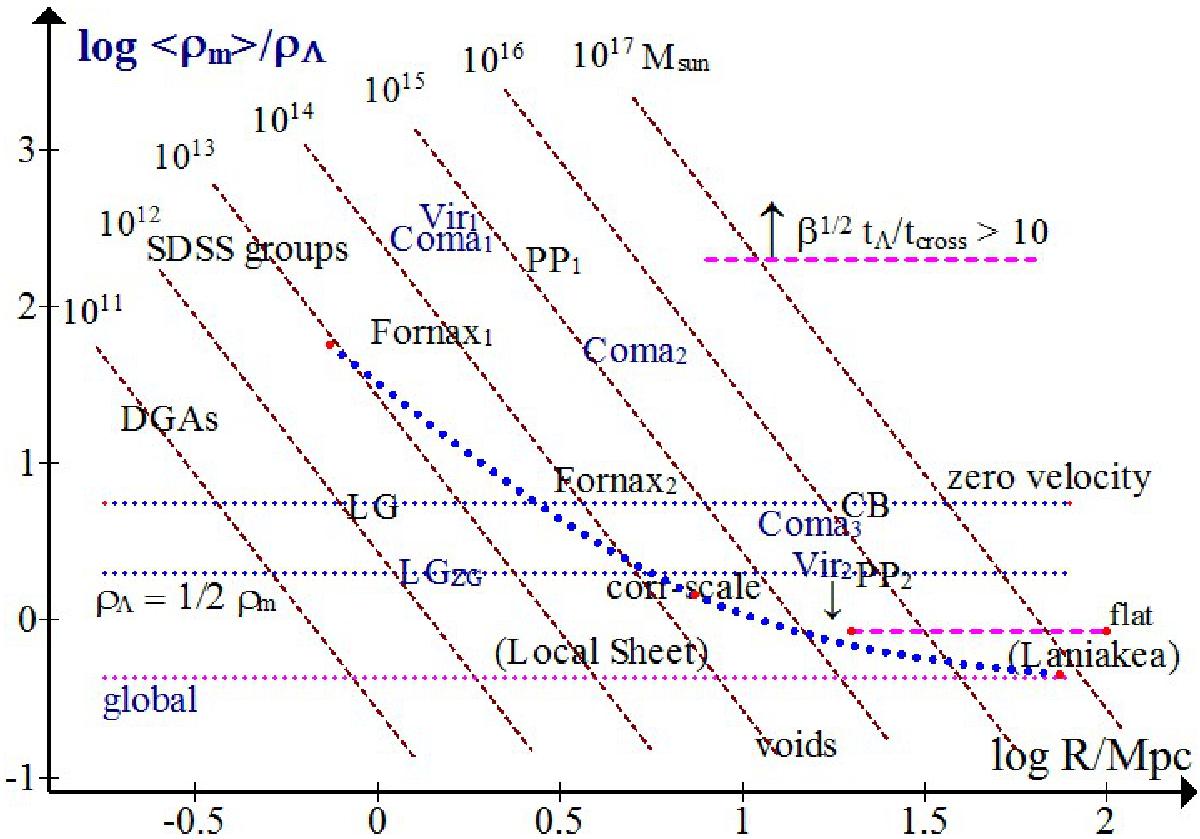
Log ⟨ ρM ⟩ /ρΛ vs. log R/ Mpc for example galaxy systems. The inclined lines are for the mass values indicated in M⊙. Some symbols are slightly shifted in crowded regions. The dotted curve gives the characteristic mass within radius R from the standard 2-point correlation function. “Flat” is the gravity = antigravity line for the limiting case of a flattened system. The region where β1/2tΛ/tcross> 10 is shown.
Current usage metrics show cumulative count of Article Views (full-text article views including HTML views, PDF and ePub downloads, according to the available data) and Abstracts Views on Vision4Press platform.
Data correspond to usage on the plateform after 2015. The current usage metrics is available 48-96 hours after online publication and is updated daily on week days.
Initial download of the metrics may take a while.