Free Access
Fig. 2
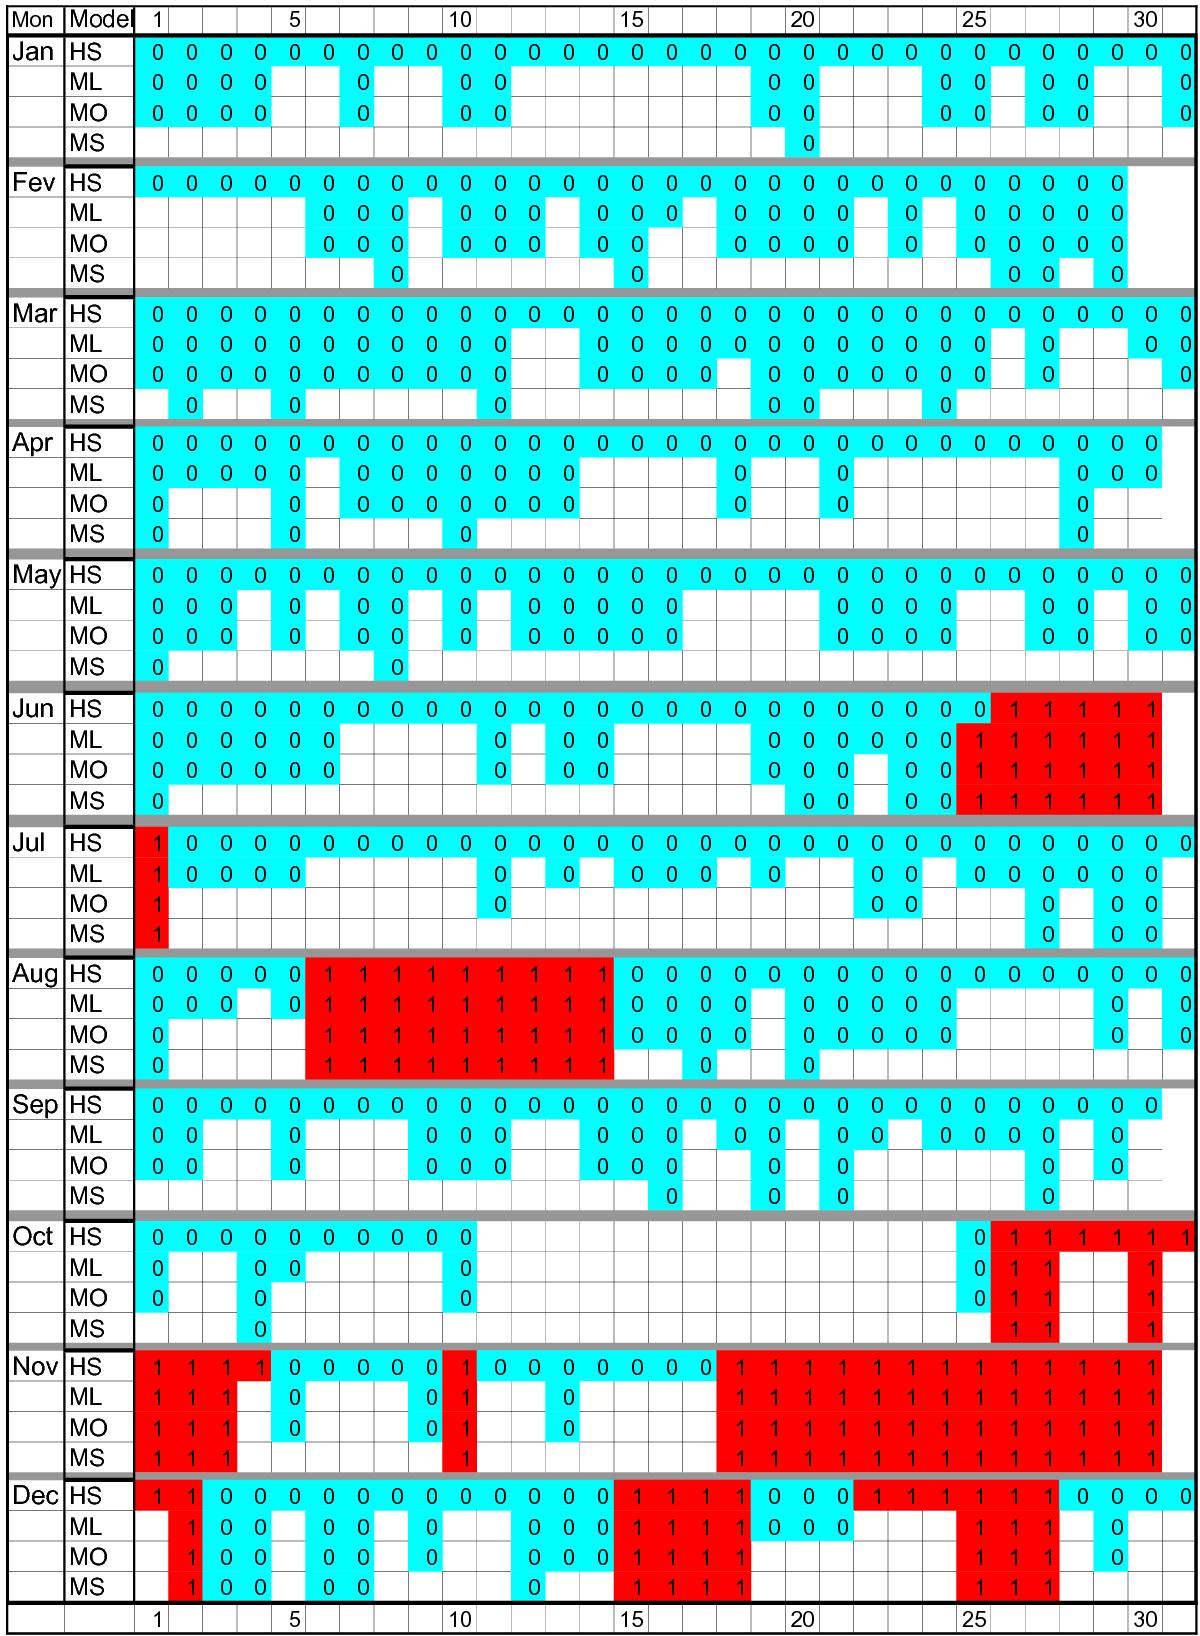
Map of the days allocated for the year 1676 in the original HS98 database (denoted as HS) and the three models considered here. Each line represents one month (days of the month numbered on the top and bottom) for a model. The empty white, blue “0”, and red “1” cells correspond to no-information, no-spot, and active days.
Current usage metrics show cumulative count of Article Views (full-text article views including HTML views, PDF and ePub downloads, according to the available data) and Abstracts Views on Vision4Press platform.
Data correspond to usage on the plateform after 2015. The current usage metrics is available 48-96 hours after online publication and is updated daily on week days.
Initial download of the metrics may take a while.