Free Access
Fig. 7
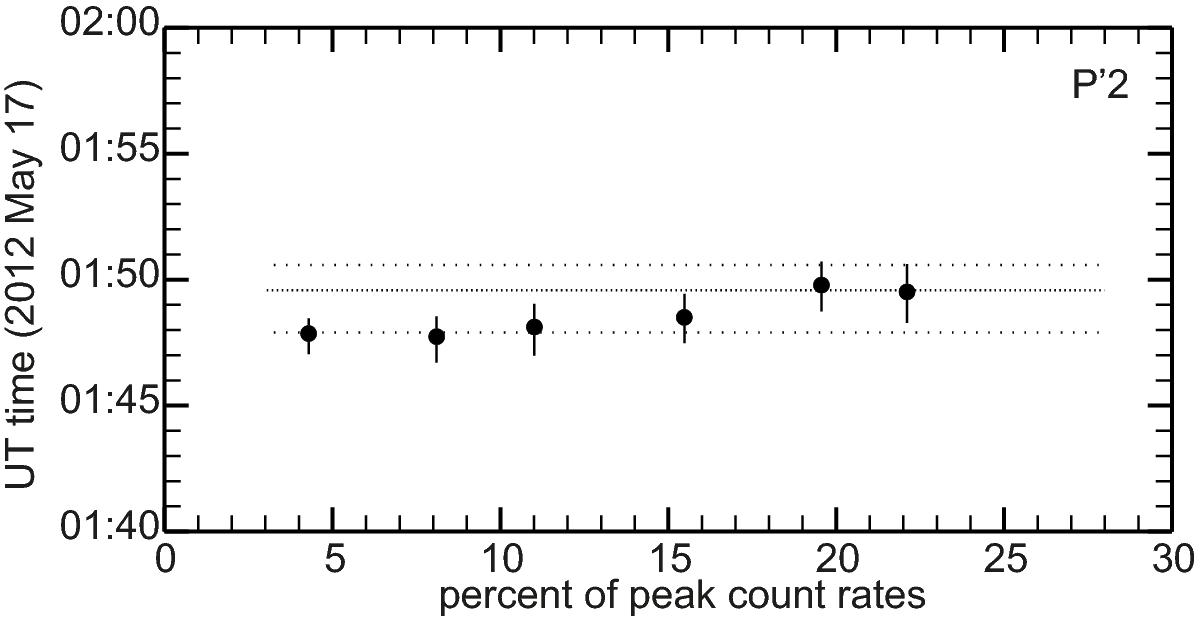
Onset times versus percentage of peak for the P’2 channel. The dotted lines correspond to average (very close dots) and uncertainty range (more widely spaced dots) of onset times determined for the Apatity neutron monitor.
Current usage metrics show cumulative count of Article Views (full-text article views including HTML views, PDF and ePub downloads, according to the available data) and Abstracts Views on Vision4Press platform.
Data correspond to usage on the plateform after 2015. The current usage metrics is available 48-96 hours after online publication and is updated daily on week days.
Initial download of the metrics may take a while.