Fig. 6
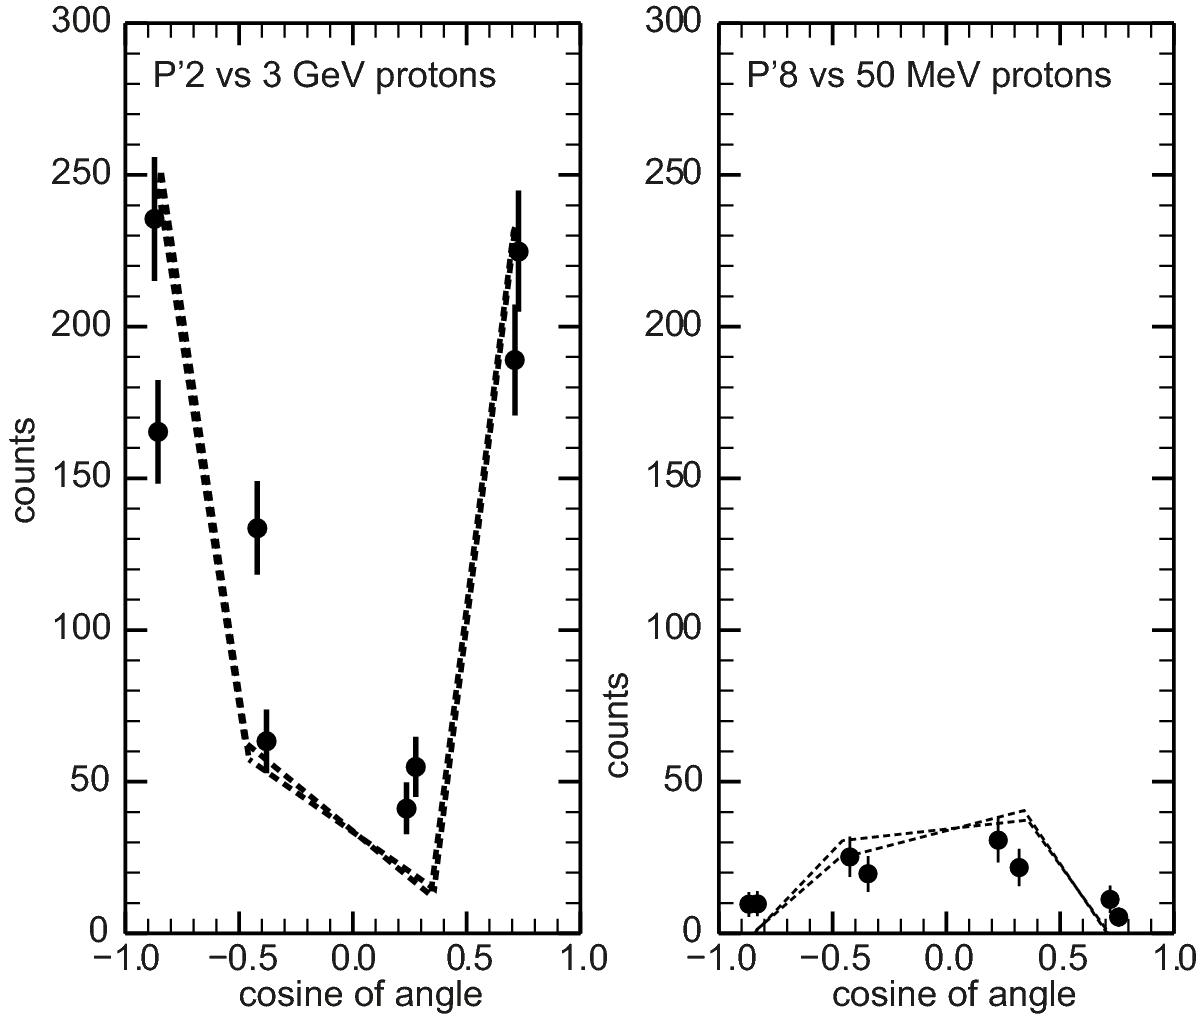
Counts as a function of the angle between the magnetic field and the normal to the M’. The dashed line joins adjacent sectors, that is, marks the progression in time from sector to sector and is a model curve obtained from Monte Carlo simulations of the detector response for field aligned protons. (left) Model versus observation for P’2 measures, 2 min integration around 02:09:41 UT. (right) Model versus observation for P’8 measures, 10 minute integration after 02:09:41 UT.
Current usage metrics show cumulative count of Article Views (full-text article views including HTML views, PDF and ePub downloads, according to the available data) and Abstracts Views on Vision4Press platform.
Data correspond to usage on the plateform after 2015. The current usage metrics is available 48-96 hours after online publication and is updated daily on week days.
Initial download of the metrics may take a while.