Free Access
Fig. 2
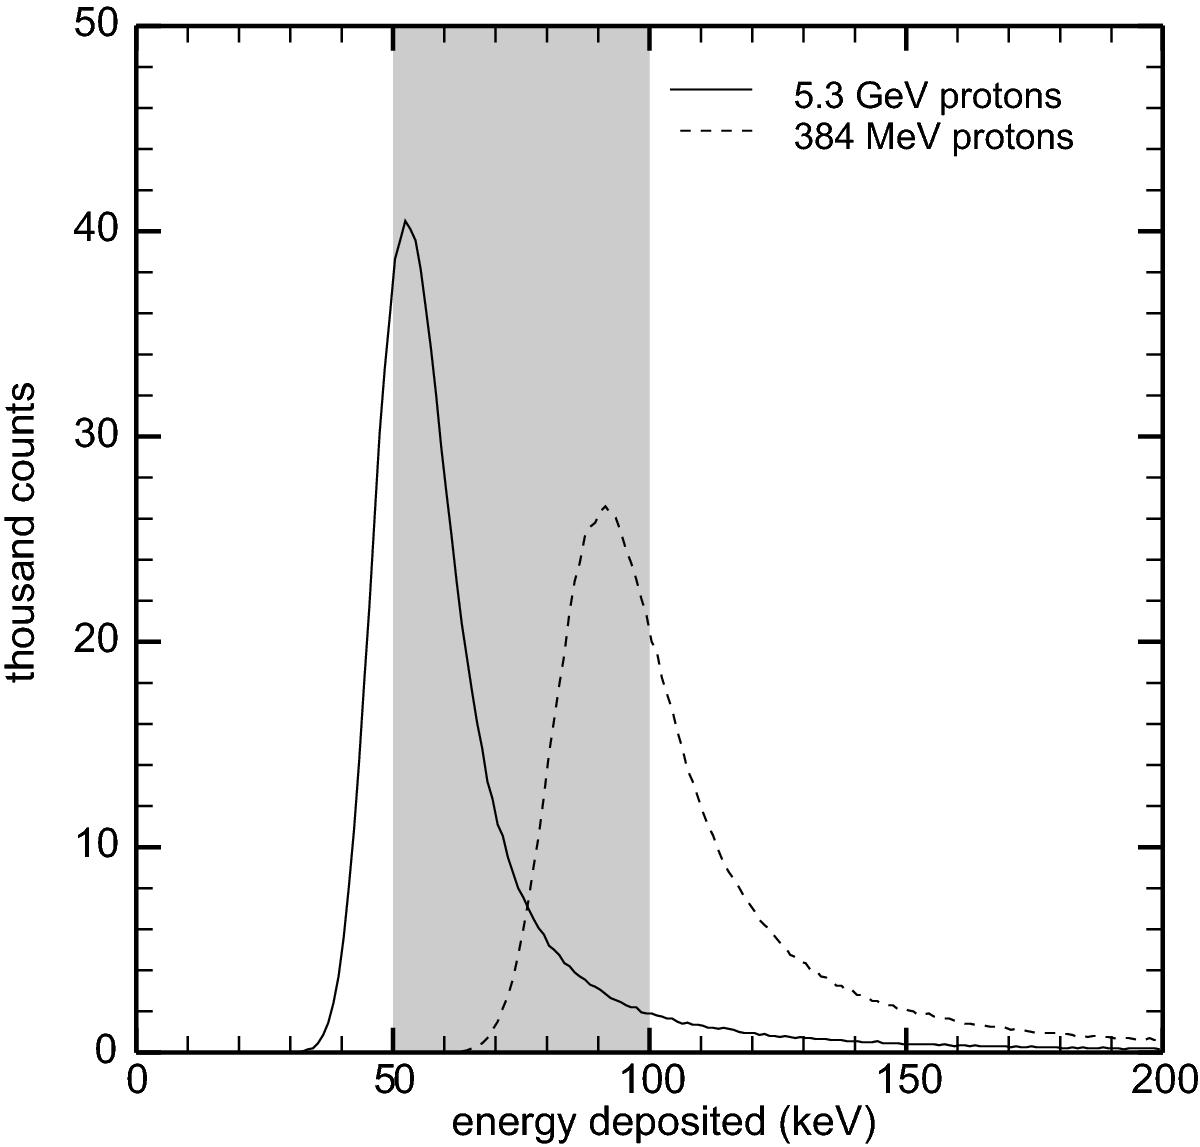
Results from Monte Carlo simulations showing number of particles versus deposited energy for two incident proton energies. A million protons were simulated at each energy, propagating parallel to the detector normal and impacting the center of the detector; the gray band marks the energy range corresponding to P’2.
Current usage metrics show cumulative count of Article Views (full-text article views including HTML views, PDF and ePub downloads, according to the available data) and Abstracts Views on Vision4Press platform.
Data correspond to usage on the plateform after 2015. The current usage metrics is available 48-96 hours after online publication and is updated daily on week days.
Initial download of the metrics may take a while.