Fig. 9
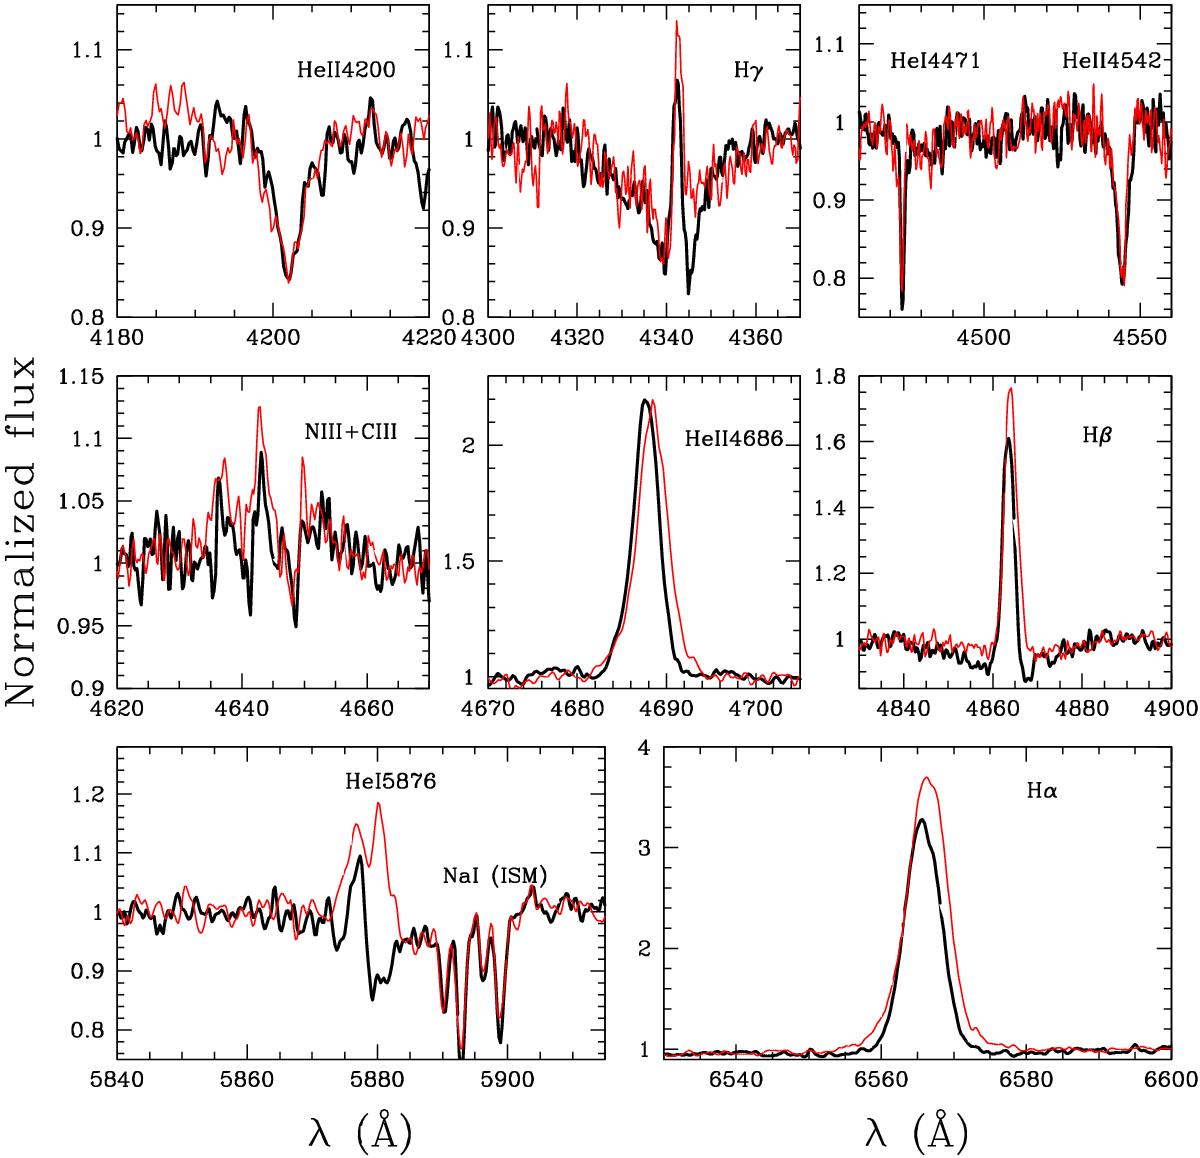
Spectra of SMC159-2 recorded in 2013 (φ = 0.96, thick black line) and 2014 (φ = 0.60, thinner red line) in selected spectral windows: clear changes in Balmer and He i lines can be seen, with stronger emissions in 2014, while photospheric He ii absorptions and interstellar lines arising in both the Galaxy and the SMC (e.g. Na D lines near 5900 Å) remain constant.
Current usage metrics show cumulative count of Article Views (full-text article views including HTML views, PDF and ePub downloads, according to the available data) and Abstracts Views on Vision4Press platform.
Data correspond to usage on the plateform after 2015. The current usage metrics is available 48-96 hours after online publication and is updated daily on week days.
Initial download of the metrics may take a while.