Fig. 2
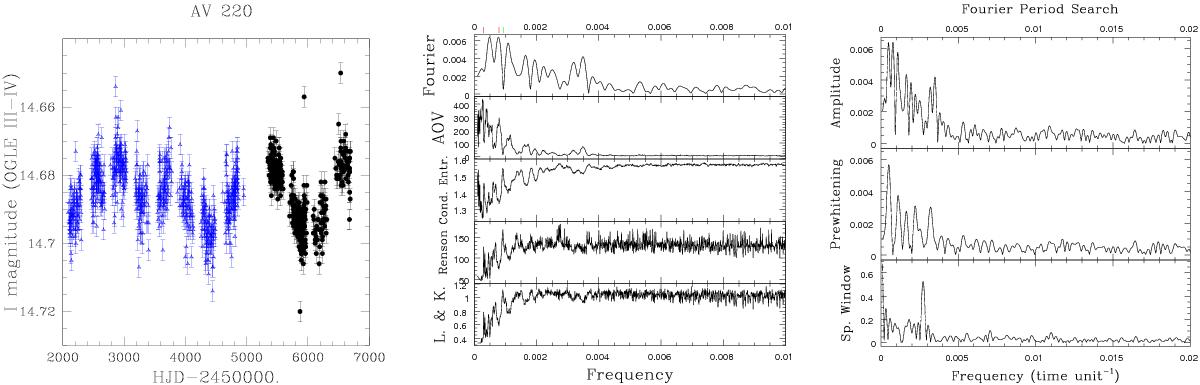
Left: OGLE-III and IV lightcurve for AV 220 (colour scheme as in Fig. 1). Middle: comparison of the different period search methods, with tickmarks at the top indicating periods of 3846 d, 1299 d, and 1100 d. The presence of a signal is marked by a maximum for Fourier and AOV methods, but by a minimum for conditional entropy, Renson and Lafler & Kinman methods. Right: Fourier periodogram for the raw (top) and prewhitened (middle, for the best-fit Fourier period P = 1299 d) data, along with the spectral window (bottom).
Current usage metrics show cumulative count of Article Views (full-text article views including HTML views, PDF and ePub downloads, according to the available data) and Abstracts Views on Vision4Press platform.
Data correspond to usage on the plateform after 2015. The current usage metrics is available 48-96 hours after online publication and is updated daily on week days.
Initial download of the metrics may take a while.