Fig. 4
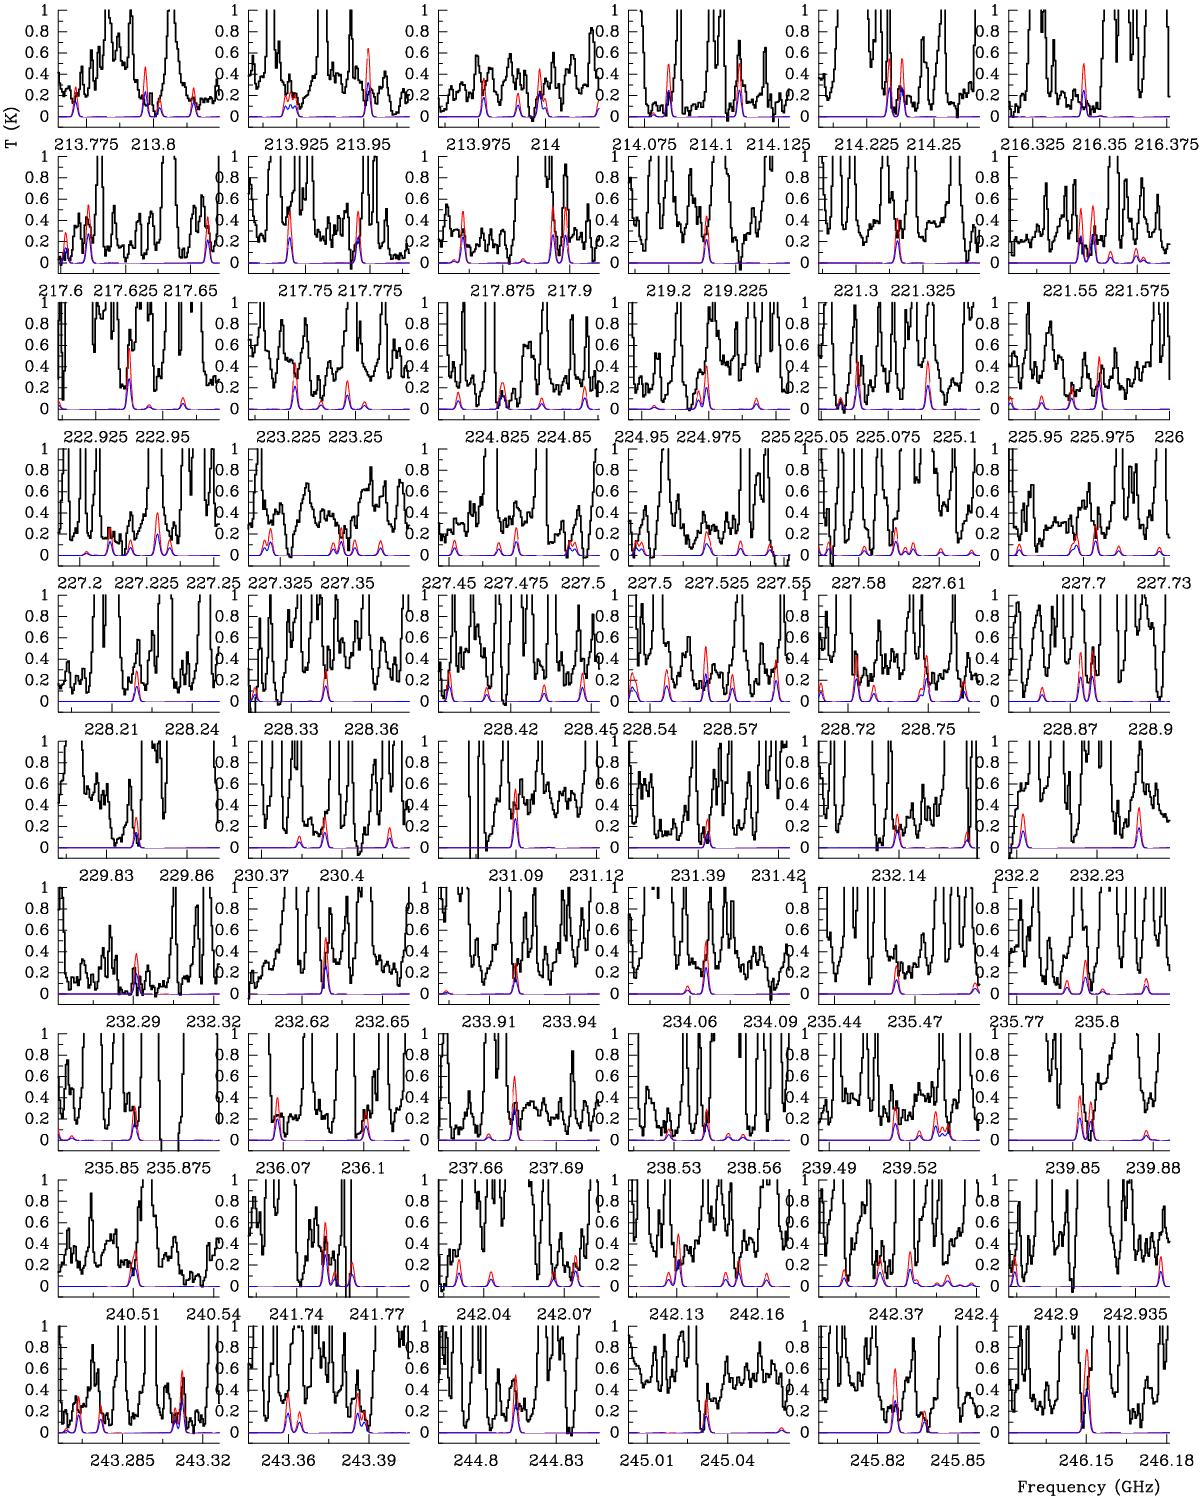
Lines of vinyl acetate, CH3COOCHCH2, towards the compact ridge of Orion KL. The black histogram is the averaged spectrum over 5 × 5 pixels around the methyl acetate peak (see text) of the ALMA SV data (see text for references); these data have a 0.5 MHz of spectral resolution. The thin red line is the synthetic spectrum assuming a column density of 2 × 1015 cm-2 for vinyl acetate (A+E species). The thin blue line is the model for vinyl acetate with a column density of 1 × 1015 cm-2 (A+E species); this model corresponds to the given column density for the tentative detection of vinyl acetate (see text). A vLSR of 7 km s-1 is assumed.
Current usage metrics show cumulative count of Article Views (full-text article views including HTML views, PDF and ePub downloads, according to the available data) and Abstracts Views on Vision4Press platform.
Data correspond to usage on the plateform after 2015. The current usage metrics is available 48-96 hours after online publication and is updated daily on week days.
Initial download of the metrics may take a while.