Fig. 3
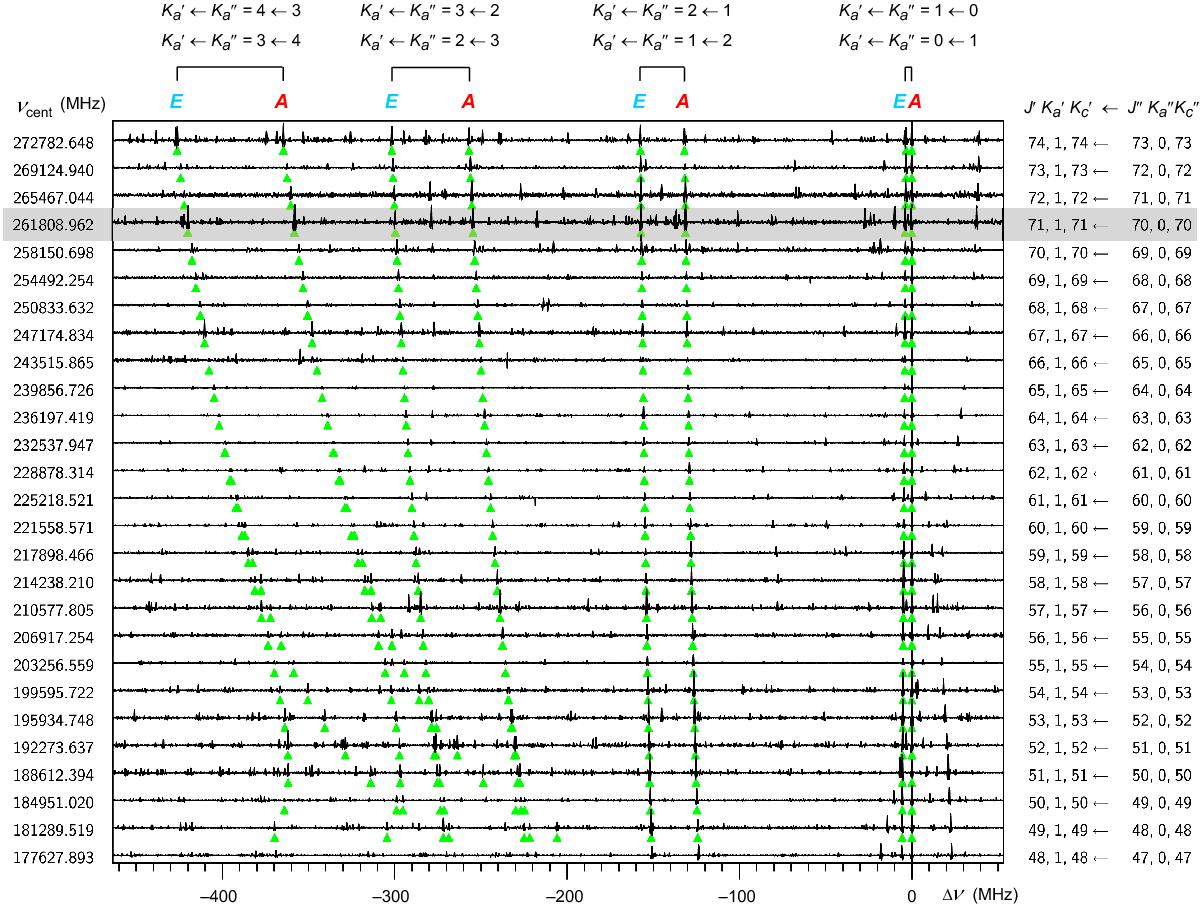
Loomis-Wood-type plot obtained from the AABS programs package (Kisiel et al. 2005) showing the identification of the stripes corresponding to the ![]() sequences of the b-type R-branch transitions for
sequences of the b-type R-branch transitions for ![]() , and 4. Each sequence has two components, A and E, due to the methyl internal rotation. Rotational transitions are lined up to the central frequencies νcent of the A-component
, and 4. Each sequence has two components, A and E, due to the methyl internal rotation. Rotational transitions are lined up to the central frequencies νcent of the A-component ![]() transitions with the rotational quantum numbers indicated on the right side of the diagram. The frequency distance Δν from the central frequency is documented on the x-axis. Each A-E doublet going to the left from the leading one at Δν = 0 corresponds to increasing Ka and decreasing J transitions. The highlighted horizontal stripe represents the part of the spectrum documented in Fig. 2b. For J′′< 60, the degeneracies for the energy levels with Ka = 3 and Ka = 4 are lifted and two separate sequences of
transitions with the rotational quantum numbers indicated on the right side of the diagram. The frequency distance Δν from the central frequency is documented on the x-axis. Each A-E doublet going to the left from the leading one at Δν = 0 corresponds to increasing Ka and decreasing J transitions. The highlighted horizontal stripe represents the part of the spectrum documented in Fig. 2b. For J′′< 60, the degeneracies for the energy levels with Ka = 3 and Ka = 4 are lifted and two separate sequences of ![]() (the left one) and
(the left one) and ![]() (the right one) transitions are recognizable for both A- and E-components.
(the right one) transitions are recognizable for both A- and E-components.
Current usage metrics show cumulative count of Article Views (full-text article views including HTML views, PDF and ePub downloads, according to the available data) and Abstracts Views on Vision4Press platform.
Data correspond to usage on the plateform after 2015. The current usage metrics is available 48-96 hours after online publication and is updated daily on week days.
Initial download of the metrics may take a while.