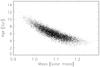
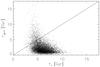
Fig. 3
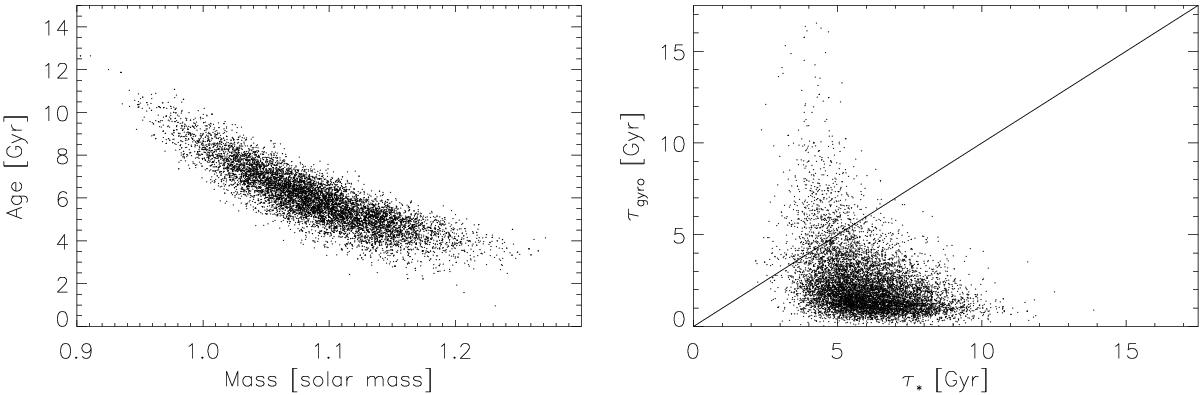
Left panel: joint posterior distribution for the mass and age of CoRoT-13 estimated by our isochrone fitting technique. Right panel: joint posterior distribution for the age of CoRoT-13 estimated by our isochrone fitting technique and using gyrochronology. For clarity, only 10% of the points from the Markov chain are plotted.
Current usage metrics show cumulative count of Article Views (full-text article views including HTML views, PDF and ePub downloads, according to the available data) and Abstracts Views on Vision4Press platform.
Data correspond to usage on the plateform after 2015. The current usage metrics is available 48-96 hours after online publication and is updated daily on week days.
Initial download of the metrics may take a while.