Fig. 2
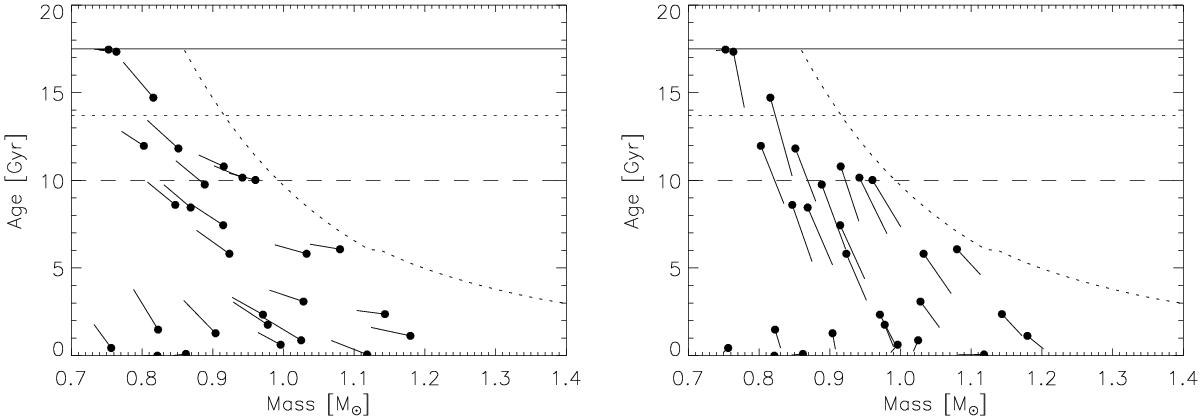
Change in the best-fitting masses and ages of transiting exoplanet host stars due to a change in the assumed helium abundance or mixing length parameter. Dots show the best-fitting mass and age for the default values of Y and αMLT and lines show the change in mass and age due to an increase in helium abundance ΔY = +0.02 (left panel) or a change in mixing length parameter ΔαMLT = −0.2 (right panel). Horizontal lines indicate the age of the Galactic disc (dashed), the age of the Universe (dotted) and the highest age in our grid of stellar models (solid). The curved dotted line shows the terminal age main sequence (TAMS) for stars with solar composition.
Current usage metrics show cumulative count of Article Views (full-text article views including HTML views, PDF and ePub downloads, according to the available data) and Abstracts Views on Vision4Press platform.
Data correspond to usage on the plateform after 2015. The current usage metrics is available 48-96 hours after online publication and is updated daily on week days.
Initial download of the metrics may take a while.