Fig. 4
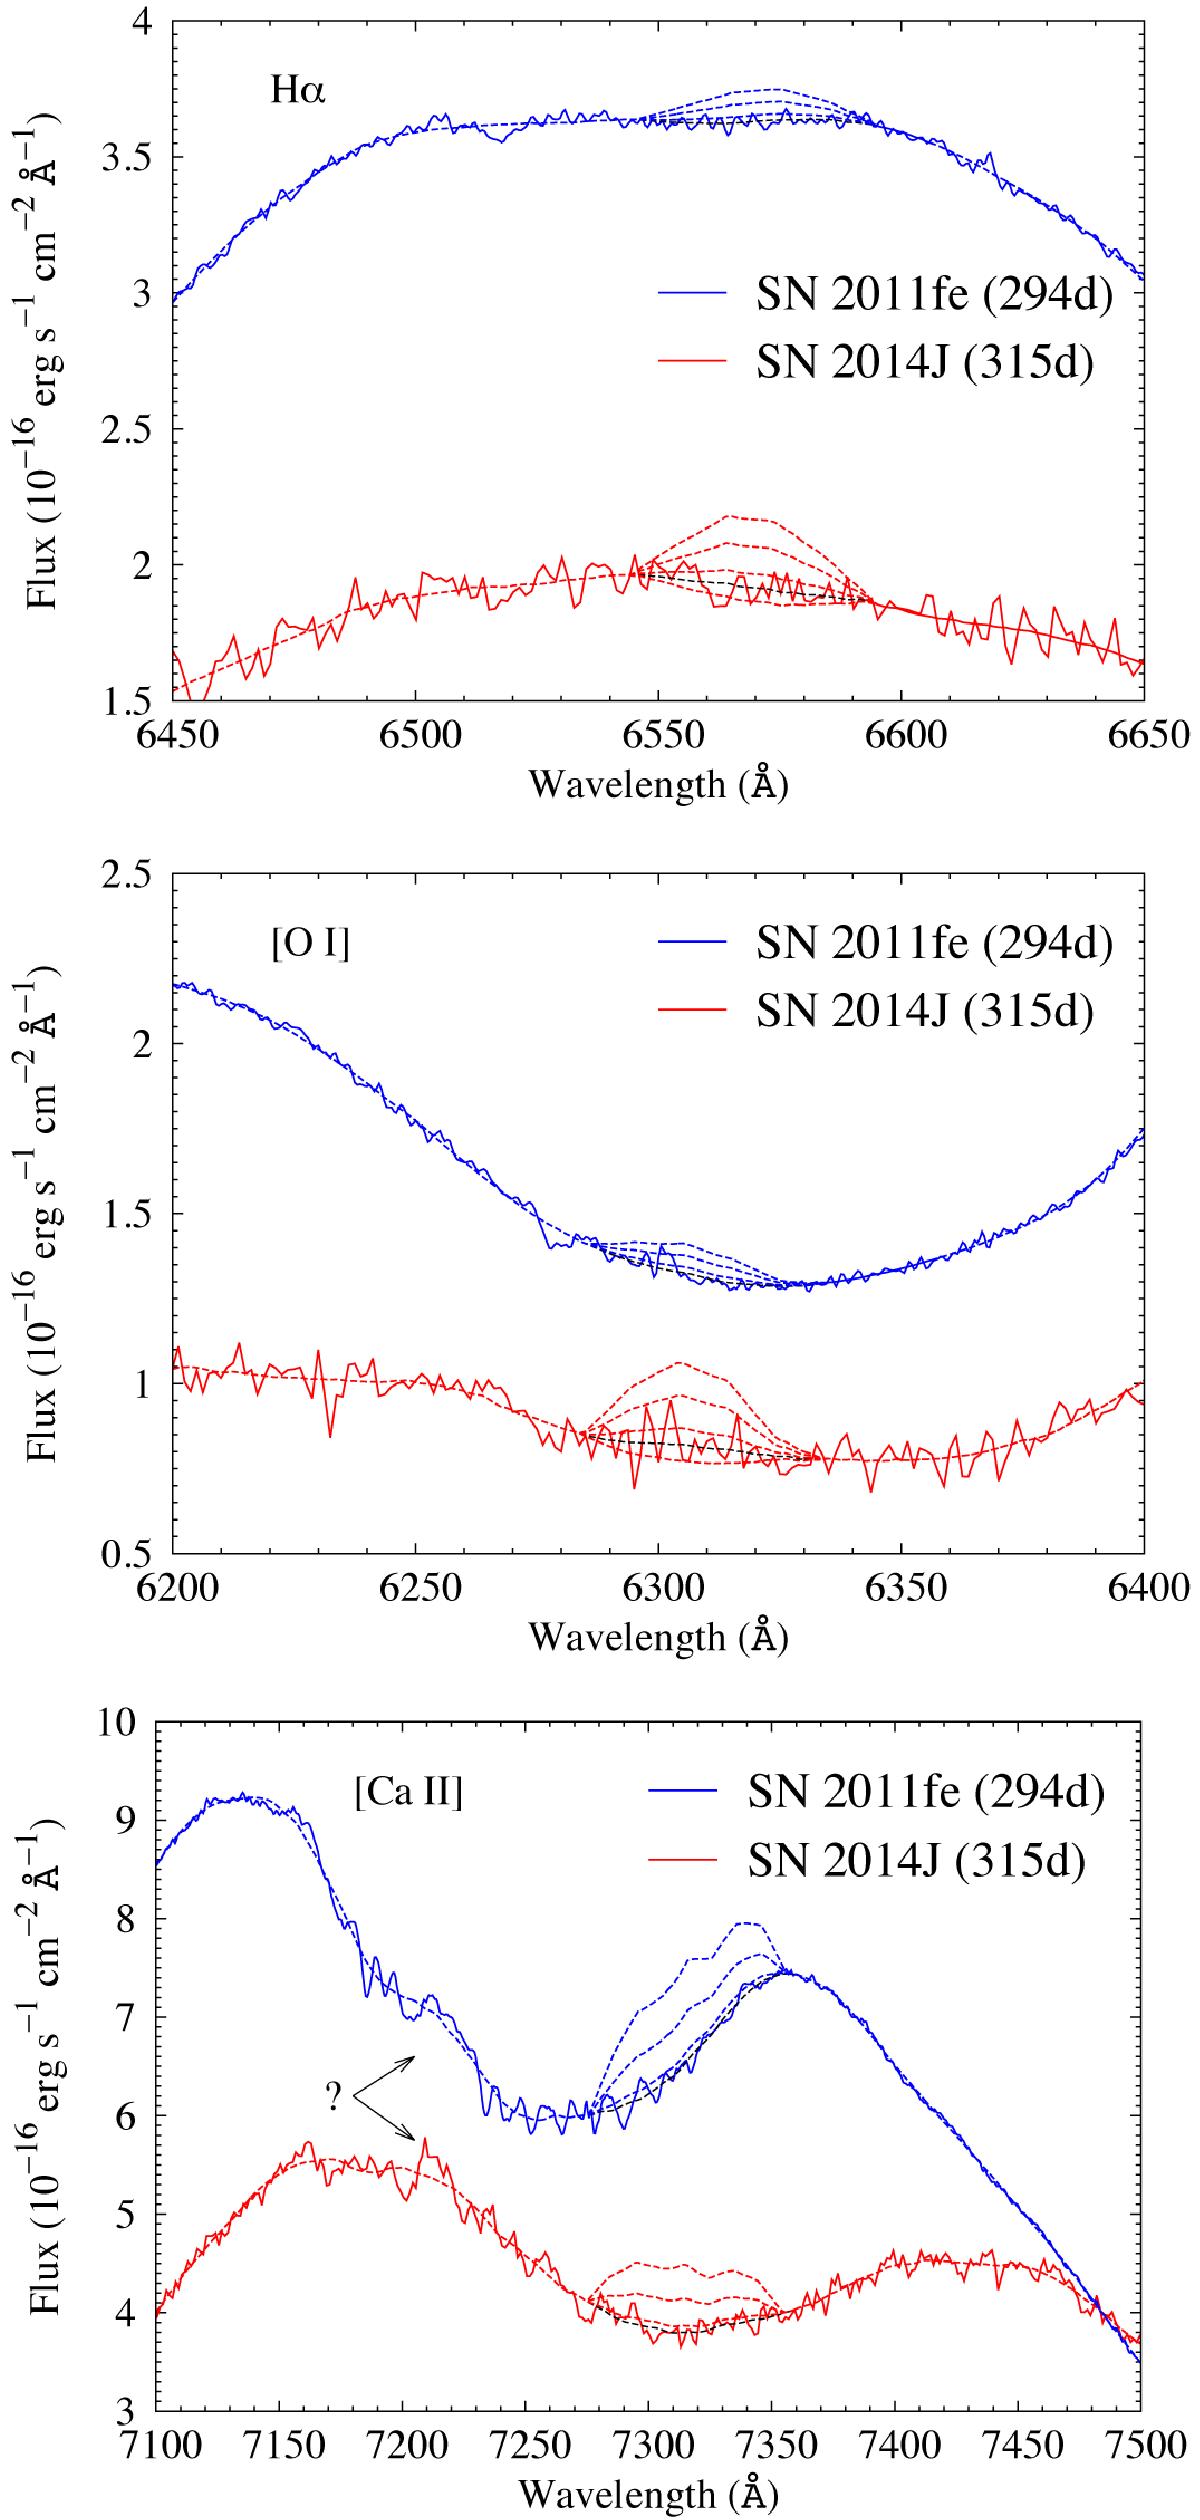
Observed spectra (solid red and blue lines) with modelled line profiles (dashed red and blue lines) added. For Hα (upper panel) and [O I] λ6300 (middle panel), the modelled fluxes are for 1×, 3×, and 5× the 3σ statistical limits on the masses estimated in Sects. 3.1 and 3.2. For Hα and [O I] λ6300 we also subtracted 1 × these masses (also shown by red dashed lines). For [Ca II] λλ7291,7324 (lower panel), we added modelled fluxes corresponding to 1×, 5×, and 10× the 3σ statistical limits on the masses estimated in Sects. 3.1 and 3.2. The dashed lines (marked in black across the line profiles) tracing the full observed spectra are the smoothed spectra using Savitzky-Golay polynomials, as outlined in Sects. 3.1 and 3.2. In the [Ca II] λλ7291,7324 panel, we have highlighted a feature around 7210 Å present in the spectra of both supernovae with a question mark. The plots show observed wavelengths.
Current usage metrics show cumulative count of Article Views (full-text article views including HTML views, PDF and ePub downloads, according to the available data) and Abstracts Views on Vision4Press platform.
Data correspond to usage on the plateform after 2015. The current usage metrics is available 48-96 hours after online publication and is updated daily on week days.
Initial download of the metrics may take a while.