Fig. 2
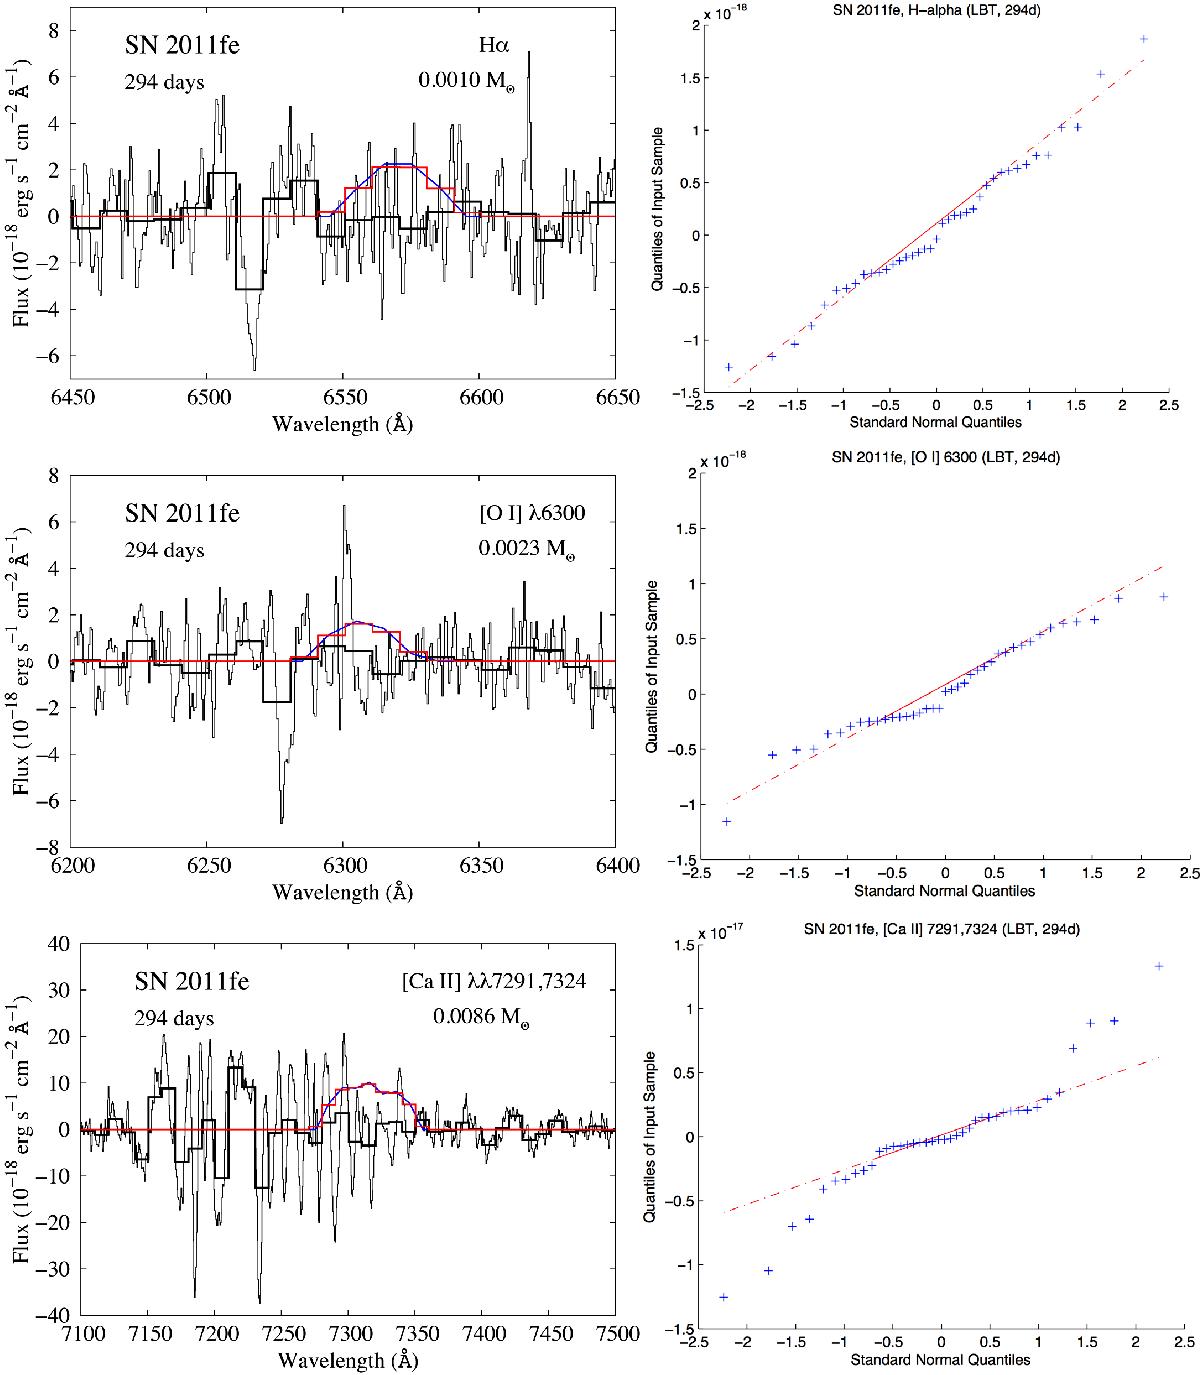
Left columns: LBT net spectra (i.e., spectra after continuum removal) of SN 2011fe 294 days after the explosion (thin black lines) in the spectral regions around Hα (upper panel), [O I] λ6300 (middle panel), and [Ca II] λλ7291, 7324 (lower panel), respectively. The thick black histogram lines show the observed spectrum after 10 Å binning. No correction for redshift was made. The blue lines show the modelled line emission, using the model in Lundqvist et al. (2013) for 294 days. The red histogram lines show the modelled flux binned to the same resolution as the binned observed spectrum. The mass of solar-metallicity material in these models are 0.0010 M⊙, 0.0023 M⊙, and 0.0086 M⊙, respectively, and correspond to estimated 3σ statistical upper limits of the mass. The modelled spectra have been redshifted by +203 kms-1 and reddened by E(B − V) = 0.026 mag to match the velocity and extinction of the supernova. A distance of 6.1 Mpc was used. The mass limit for Hα agrees with that of Shappee et al. (2013) using the same data. Right columns: quantile-quantile plots of the data in the net spectra. Blue data points are from the distribution of binned fluxes (in 10 Å bins) for 400 Å spectral regions around the modelled lines. The dashed red lines are for the simulated normal distribution. As can be seen, the data samples do not deviate appreciably from a normal distribution, except for the [Ca II] lines. The spectral bins dominated by telluric features at ~6275 Å and ~6520 Å (cf. Shappee et al. 2013) were removed from the sample prior to analysis. See text for further details.
Current usage metrics show cumulative count of Article Views (full-text article views including HTML views, PDF and ePub downloads, according to the available data) and Abstracts Views on Vision4Press platform.
Data correspond to usage on the plateform after 2015. The current usage metrics is available 48-96 hours after online publication and is updated daily on week days.
Initial download of the metrics may take a while.