| Issue |
A&A
Volume 577, May 2015
|
|
|---|---|---|
| Article Number | A95 | |
| Number of page(s) | 5 | |
| Section | Atomic, molecular, and nuclear data | |
| DOI | https://doi.org/10.1051/0004-6361/201525711 | |
| Published online | 08 May 2015 | |
Resolution of the forbidden (J = 0 → 0) excitation puzzle in Mg-like ions
1 Department of Physics, University of Strathclyde, Glasgow G4 0NG, UK
e-mail: luis.fernandez-menchero@strath.ac.uk
2 Department of Applied Mathematics and Theoretical Physics, University of Cambridge, Cambridge CB3 0WA, UK
Received: 21 January 2015
Accepted: 8 April 2015
We investigate the source of the discrepancy between R-matrix and distorted-wave (DW) collision strengths for J − J′ = 0–0 transitions in Mg-like ions, for example 3s21S0–3p21S0, as reported previously. We find it to be due to the neglect of coupling, for example via 3s3p 1P1, as done by most DW codes. We have implemented an option to account for such coupling as a perturbation within the autostructure DW code. This removes the discrepancy of a factor ~10 and ~100 for Fe14 + and S4 +, respectively, for such transitions. The neglect of coupling would have affected (to some degree) the atomic data for a few weak optically forbidden transitions in other isoelectronic sequences if they were calculated with DW codes such as FAC and HULLAC. In addition, we compare the Fe14 + line intensities predicted with the R-matrix collision strengths against observations of solar active regions and flares; they agree well. For Fe14 +, we suggest that the best density diagnostic ratio is 327.0/321.8 Å.
Key words: atomic data / techniques: spectroscopic
© ESO, 2015
1. Introduction
In a recent paper (Fernández-Menchero et al. 2014b), we used the intermediate coupling frame transformation R-matrix method to calculate electron-impact excitation data for all ions of the Mg-like isoelectronic sequence from Al+ to Zn18 + for all transitions involving levels up to principal quantum number n = 5. We also carried out distorted-wave (DW) calculations using the code autostructure (AS; Badnell 2011) and exactly the same atomic structure as we used for the R-matrix calculations. We compared our AS-DW results, as well as those from other DW codes viz. the Flexible Atomic Code (FAC; Gu 2003) developed by Landi (2011) and the code UCL-DW (Eissner 1998; Saraph 1972) developed by Christensen et al. (1985), with our R-matrix results for Fe14 +. We found large differences between our R-matrix background collision strengths and those from AS-DW and FAC by Landi (2011) for some weak J − J′ = 0–0 transitions, for example, by an order of magnitude for the 3s21S0–3p21S0. Conversely, the UCL-DW results of Christensen et al. (1985) broadly agreed with the R-matrix results. Clearly, the source of the difference must lie in the treatment of the (DW) scattering problem, not in the description of the atomic structure.
It is important to understand the origin of this large disagreement in the collision strengths calculated with different methods. Even today, the DW method is still relied upon extensively for calculations of electron-impact data for excitation and ionization of atoms, ions, and molecules. It is stored in databases such as CHIANTI1 (Landi et al. 2013) and OPEN ADAS2. These data is then used in turn by plasma modellers to determine spectral diagnostics for both astrophysical and magnetic fusion plasmas.
2. Methodologies
The R-matrix close-coupling and DW methods solve the formal scattering equations for the colliding electron in their respective approximations (Eissner & Seaton 1972). Thence, they both calculate the elements of the reactance matrix K, which is related to the transmission matrix T by  (1)and the resulting scattering matrix, S = 1 − T, is unitary. The collision strength (Ωij) and cross section (Qij) for any transition i − j is then easily determined since
  (2)The R-matrix method solves the closely coupled scattering equations and so naturally determines all elements of the K-matrix for a given set of target levels. A significant advantage of the DW method is that it does not need to calculate the entire K-matrix since it solves uncoupled radial scattering equations. Formally, it can make use of
 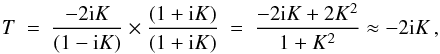 (3)for small K , which is usually the case for atoms that are ionized several times (Hayes & Seaton 1977).
In most astrophysical and magnetic fusion plasmas the main population of any given ion lies in its ground and metastable levels M. The main radiating properties of the full set of excited levels N are then determined by collisional excitation from levels M to N, followed by radiative cascade. The DW method then only needs to solve an M × N problem, for M ≪ N, as opposed to the N2 problem for the R-matrix method. Of course, the DW method normally neglects resonances, but their contribution rapidly diminishes for more highly excited levels.
The codes AS-DW, FAC and, indeed, HULLAC (Bar-Shalom et al. 1988), all make use of Eq. (3), sometimes referred to as the weak coupling DW approximation, and are said to be non-unitarized DW methods. However, the UCL-DW code has the option of using Eq. (1) and is said to be a unitarized DW method when it does so, this is sometimes referred to as the strong coupling DW approximation. We speculated (Fernández-Menchero et al. 2014b) that this might be the source of the differences in weak collision strengths for forbidden J − J′ = 0–0 transitions since the use of Eq. (1) treats the close coupling as a perturbation within the DW method (Seaton 1961), while the use of Eq. (3) neglects it completely. Although AS-DW has the ability of calculating all elements of the K-matrix (M = N), it did so on the fly, the full matrix was never held. We have now implemented an option to retain the full K-matrix and so utilize Eq. (1) to give a unitarized method (AS-UDW).
3. Results
3.1. Atomic structure
The atomic structure was calculated with the program autostructure (Badnell 2011). We included the configurations { (1s2 2s2 2p6) 3s2,3s 3p,3s 3d,3p2,3p 3d,3d2,3 { s,p,d } nl } with n = 4,5 and for l = 0–4. This yields 283 intermediate coupling levels. The energies calculated for the 15 lowest levels of Fe14 + and S4 + are shown in Tables 1 and 2. Further details of the atomic structure calculation can be found in Fernández-Menchero et al. (2014b).
Fe14 + target levels.
S4 + target levels.
3.2. Collisions
In Figs. 1 and 2 we show the electron-impact excitation collision strength Ω for the transition 3s21S0 − 3p21S0 of the ions Fe14 + and S4 +. We compare the results of R-matrix and (non-unitarized) AS-DW calculations by Fernández-Menchero et al. (2014b) with the UCL-DW calculations of Christensen et al. (1985) and FAC-DW of Landi (2011) for Fe14 + and UCL-DW of Christensen et al. (1986) for S4 + and compare them with present (unitarized) AS-UDW results. The AS-(U)DW results were obtained using exactly the same target atomic structures as the R-matrix results.
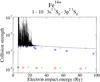 |
Fig. 1 Electron-impact excitation collision strength versus the impact energy for the transition 3s21S0–3p21S0 of Fe14 + . Full line: R-matrix (Fernández-Menchero et al. 2014b); ×: AS-DW (Fernández-Menchero et al. 2014b); +: AS-UDW (present work); □: FAC-DW (Landi 2011); ◇: UCL-DW (Christensen et al. 1985). |
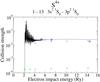 |
Fig. 2 Electron-impact excitation collision strength versus the impact energy for the transition 3s21S0–3p21S0 of S4 +. Full line: R-matrix (Fernández-Menchero et al. 2014b); ×: AS-DW (Fernández-Menchero et al. 2014b); +: AS-UDW (present work); ◇: UCL-DW (Christensen et al. 1986). |
The background collision strengths of Christensen et al. (1985, 1986) obtained with the UCL-DW code are quite close to the R-matrix strengths; the differences can be attributed to the different atomic structures used. However, the FAC-DW results of Landi (2011) (Fe14 + only) and the AS-DW results of Fernández-Menchero et al. (2014b) differ by large factors from the R-matrix results for this transition: ~10 for Fe14 + and ~100 for the S4 +. However, the AS-UDW results show a dramatic increase over the non-unitarized ones by very similar factors. This demonstrates that this transition is dominated (~90% and ~99%) by coupling. It also shows that the original speculation of Fernández-Menchero et al. (2014b) was correct: the results of Christensen et al. (1985, 1986) were obtained using the unitarized option of the UCL-DW code.
We carried out a series of calculations for which we progressively reduced the number of target configurations included in the scattering calculation to determine the source of the coupling for the 3s21S0–3p21S0 transition. It was still present with a three-configuration (3s2,3s3p,3p2) target expansion, but disappeared when we omitted the 3s3p. As expected, perhaps, the dominant coupling mechanism is thus the double dipole mechanism: 3s21S0 → 3s3p 1P1 → 3p21S0.
Given that the R-matrix and AS-(U)DW calculations used the same atomic structure, one might wonder about the consistency of the high-energy behaviour of the collision strengths: R-matrix and AS-UDW should tend to the same Born limit as the non-unitarized AS-DW. As demonstrated by Fernández-Menchero et al. (2014b), a reduced Burgess–Tully diagram (Burgess & Tully 1992) shows that the R-matrix collision strength turns over at high energy and attains the same limit as the AS-DW collision strength. The present AS-UDW results follow the same behaviour at high energy as those of the R-matrix.
In Table 3 we compare Maxwellian-integrated effective collision strengths Υ for the 3s21S0–3p21S0 transition in Fe14 + at a temperature of 2.5 × 10⁶ K. The present AS-UDW effective collision strength still differs by a factor 2 from that of the R-matrix (Eissner et al. 1999; Fernández-Menchero et al. 2014b). We recall that the collision strengths of Fernández-Menchero et al. (2014b) used exactly the same atomic structure for the target, which means that the difference is mainly due to the contribution from resonances. The difference in background collision strengths is no more than ≈15% – see also Fig. 1. The (unitarized) UCL-DW result of Christensen et al. (1985) closely agrees with the present AS-UDW result. The non-unitarized AS-DW and FAC-DW results also closely agree with each other, but are more than a factor of 10 smaller than the unitarized DW results. The UCL-DW result of Bhatia & Mason (1997) is nearly a factor of 10 smaller again than the non-unitarized results. This indicates that Bhatia & Mason (1997) probably used the non-unitarized UCL-DW option and that their atomic structure is somewhat different for this transition.
Electron-impact excitation effective collision strengths for the transition 3s21S0–3p21S0 of Fe14 + at an electron temperature of T = 2.25 × 10⁶ K.
3.3. Comparison to observations for Fe14+
We have seen the large differences in the collision strengths of the 1–10 3s21S0–3p21S0 transition in Fe14 +. It is therefore useful to validate our R-matrix results against observations. As briefly discussed in Fernández-Menchero et al. (2014b), a significant fraction of the population of the upper level 103p21S is due to the above transition, the direct excitation from the ground state. This upper level mainly decays with an allowed transition to level 5,  .
.
This means that the intensity of the 5–10 transition is directly affected by the collision strength of the above 1–10 3s21S0–3p21S0 transition, therefore we calculated the level populations for this ion using our atomic data (Fernández-Menchero et al. 2014b) to compare the relative intensity of the 5–10 transition to those of other lines. We only considered lines close in wavelength to avoid possible issues in terms of instrument calibration.
The 5–10 transition is in itself a troublesome line in terms of its identifications. This transition (together with other lines) was identified by Churilov et al. (1985) using laboratory spectra with a line observed at 324.98 Å. The identifications were mainly based on wavelength coincidences (the line intensities were not calibrated). There were previous suggestions that a solar line at 323.57 Å was instead due to this transition (Cowan & Widing 1973), therefore Keenan et al. (1993) considered Skylab S082A intensities of several solar flares to assess whether the identification was correct. The Skylab observations confirmed the identification made by Churilov et al. (1985), although there is a large scatter in the intensity of this line, which is always weak in the solar spectra. The 324.98 Å line was invisible in the active region SERTS-89 spectra of Thomas & Neupert (1994), which led Young et al. (1998) to suggest that the identification of the 324.98 Å line as the 5–10 transition was probably not correct.
One way to compare at once the observed intensities of several lines with the predicted ones is to plot the emissivity ratios Rji (Del Zanna et al. 2004), which are basically the ratios of the observed (Iob, energy units) and the calculated line emissivities as a function of the electron density Ne: 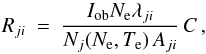 (4)where Nj(Ne,Te) is the population of the upper level j relative to the total number density of the ion, calculated at a fixed temperature Te (the ratios of the lines considered here have little temperature sensitivity, and we have taken as Te the value of peak ion abundance in ionization equilibrium); λji is the wavelength of the transition, Aji is the spontaneous radiative transition probability, and C is a scaling constant that is the same for all the lines within one observation. If experimental and theoretical intensities agree, all lines should be closely spaced or intersect for a near isodensity plasma. The value of C is chosen so that the emissivity ratios Rji are near unity where they intersect.
 |
Fig. 3 Emissivity ratio plots for some Fe14 + EUV lines observed by Skylab (above) and SERTS-97 (below). |
If we consider the first of the flares considered by Keenan et al. (1993) and plot the emissivity ratios as a function of density, we obtain the results shown in Fig. 3 (top). There is excellent (to within a relative few percent) agreement between observed and predicted intensities for the 327.0, 292.3, 321.8, and 325.0 Å lines at a density of 1010.3 cm-3, which in turn agrees excellently well with the densities obtained from other ions. This is an improvement over the atomic data used at the time by Keenan et al. (1993). The 312.6 Å line is known to be blended (probably with Co XVII), and the 317.6 Å has been known to be severely blended (possibly with Na VI).
There are various other extrem UV (EUV) observations of the Fe XV lines, but often spectra have not been properly calibrated or did not have enough resolution or sensitivity (the 325.0 Å line is weak). However, there is a well-calibrated SERTS-97 spectrum (Brosius et al. 2000) where the 325.0 Å line was visible, however. Most of the lines listed as due to Fe XV are severely blended, but good agreement is found in the intensities of the 327.0, 321.8, and 325.0 Å lines, as shown in Fig. 3 (bottom). As already mentioned, the 312.6 Å is known to be blended with Co XVII, while the 304.9 Å line is possibly blended with Mn XIV. Similar results were obtained (using different atomic data) by Keenan et al. (2005). We also considered the SERTS-89 spectrum, where more lines were observed (but not the 5–10 transition), finding an overall good agreement between theory and observation.
In conclusion, the few solar observations of the 5–10 line show very good agreement between the observed and predicted intensity of this line, which confirms the reliability of the R-matrix calculations. We note that Kastner & Bhatia (2001) built an ion population model using the Iron Project R-matrix calculations of Eissner et al. (1999). Their predicted intensity of the 5–10 transition, relative to the 4–7 327.03 Å line, is 0.085, relatively close to the two observed values, 0.105 and 0.115, and our predicted value of 0.115 (at a density of 1010 cm-3). Indeed, the effective collision strengths of the calculations reported by Eissner et al. (1999) are close to ours, as shown in Table 3.
Finally, we note that Keenan et al. (1993) suggested that the 325.0 Å transition would be an excellent density diagnostic for the solar corona, but the 327.0 Å line has a similar sensitivity at typical active region/flare densities, so it is to be preferred because it is much stronger. We suggest that the best diagnostic ratio for Fe XV is the 327.0/321.8 Å. The lines are both strong, unblended, and are close in wavelength.
3.4. Other sequences
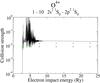 |
Fig. 4 Electron-impact excitation collision strength versus the impact energy for the transition 2s21S0 − 2p21S0 of O4 +. Full line: R-matrix (Fernández-Menchero et al. 2014a); ×: AS-DW (present work); +: AS-UDW (present work). |
What about systems other than Mg-like? The obvious one is Be-like – the n = 2 analogue: 2s2,2s2p,2p2. In Fig. 4 we show the R-matrix collision strengths derived by Fernández-Menchero et al. (2014a) for O4 + (the same residual charge as Mg-like S) and compare them with the present non-unitarized and unitarized AS-(U)DW results, calculated with the same atomic structure. We see that that R-matrix background collision strengths and the AS-UDW are similar in magnitude to the S4 + results shown in Fig. 2. In contrast, however, the non-unitarized AS-DW results are much larger than in the corresponding S case – neglect of coupling only reduces them by a factor of ~2 instead of ~100. The reason for this, it turns out, is that the 2s2 is more strongly mixed with the 2p21S0 than in the corresponding n = 3 case. There is enough admixture of 2s2 in the 2p21S0 state for it to proceed directly through the target mixing. In contrast, the 3p21S0 state is pure enough that very little collision strength arises directly.
Since the transition J − J′ = 0–0 takes place through target state mixing, which is small in general, the total collision strength is expected to be strongly sensitive to small changes in the atomic structure. We have found that making small changes in the atomic structure, so that the mixing coefficients change, can change the collision strength calculated with AS-DW by a factor 10, while the collision strength calculated with AS-UDW remains much more stable (to within ~20%).
We have detected this coupling effect only in very weak optically forbidden transitions (J − J′ = 0–0). In the coronal approximation, where the population of an ion is concentrated in the ground state, the population of such upper states in general does not come from a direct excitation from the ground state, but from radiative cascading from more excited states. However, the 3p2 case, being a double electron jump from the ground, is only populated weakly by cascade. In higher density plasmas (≳1014 cm-3), such as magnetic fusion, the 3s3p 3P2 population can be expected to drive the 3p21S0 population by direct excitation.
4. Conclusion
We have implemented an option in the AS-DW code to convert the reactance K-matrices to the transmission T-matrices that gives rise to unitary scattering S-matrices – AS-UDW. Physically, this corresponds to treating all coupling of the scattering equations as a perturbation. The effect of coupling is very large for select transitions: J = 0 → 0 in Mg-like ions.
The neglect of coupling is the reason for the large differences found in Fernández-Menchero et al. (2014b) for these transitions between R-matrix and distorted wave results, including those that used exactly the same atomic structure. The implementation of AS-UDW corrects for this difference.
We compared the theoretical line intensities obtained using the R-matrix results for Mg-like iron with solar observations and found good agreement, confirming the reliability of the calculations.
Finally, we point out that the neglect of coupling would have affected (to some degree) the atomic data for a few weak optically forbidden transitions in other isoelectronic sequences, calculated with non-unitarized DW codes such as FAC and HULLAC.
Acknowledgments
The present work was funded by STFC (UK) through the University of Strathclyde UK APAP network grant ST/J000892/1 and the University of Cambridge DAMTP astrophysics grant.
References
- Badnell, N. R. 2011, Comput. Phys. Commun., 182, 1528 [NASA ADS] [CrossRef] [Google Scholar]
- Bar-Shalom, A., Klapisch, M., & Oreg, J. 1988, Phys. Rev. A, 38, 1773 [NASA ADS] [CrossRef] [PubMed] [Google Scholar]
- Bhatia, A. K., & Mason, H. E. 1997, At. Data Nucl. Data Tables, 66, 119 [Google Scholar]
- Brosius, J. W., Thomas, R. J., Davila, J. M., & Landi, E. 2000, ApJ, 543, 1016 [NASA ADS] [CrossRef] [Google Scholar]
- Burgess, A., & Tully, J. A. 1992, A&A, 254, 436 [NASA ADS] [Google Scholar]
- Christensen, R. B., Norcross, D. W., & Pradhan, A. K. 1985, Phys. Rev. A, 32, 93 [NASA ADS] [CrossRef] [Google Scholar]
- Christensen, R. B., Norcross, D. W., & Pradhan, A. K. 1986, Phys. Rev. A, 34, 4704 [NASA ADS] [CrossRef] [Google Scholar]
- Churilov, S. S., Kononov, E. Y., Ryabtsev, A. N., & Zayikin, Y. F. 1985, Phys. Scr., 32, 501 [NASA ADS] [CrossRef] [Google Scholar]
- Cowan, R. D., & Widing, K. G. 1973, ApJ, 180, 285 [NASA ADS] [CrossRef] [Google Scholar]
- Del Zanna, G., Berrington, K. A., & Mason, H. E. 2004, A&A, 422, 731 [NASA ADS] [CrossRef] [EDP Sciences] [Google Scholar]
- Eissner, W. 1998, Comput. Phys. Comm., 114, 295 [Google Scholar]
- Eissner, W., & Seaton, M. J. 1972, J. Phys. B: Atom. Mol. Phys., 5, 2187 [Google Scholar]
- Eissner, W., Galavís, M. E., Mendoza, C., & Zeippen, C. J. 1999, A&AS, 137, 165 [NASA ADS] [CrossRef] [EDP Sciences] [Google Scholar]
- Fernández-Menchero, L., Zanna, G. D., & Badnell, N. R. 2014a, A&A, 566, A104 [NASA ADS] [CrossRef] [EDP Sciences] [Google Scholar]
- Fernández-Menchero, L., Zanna, G. D., & Badnell, N. R. 2014b, A&A, 572, A115 [NASA ADS] [CrossRef] [EDP Sciences] [Google Scholar]
- Gu, M. F. 2003, ApJ, 590, 1131 [NASA ADS] [CrossRef] [Google Scholar]
- Hayes, M. A., & Seaton, M. J. 1977, J. Phys. B: Atom. Mol. Phys., 10, L573 [NASA ADS] [CrossRef] [Google Scholar]
- Kastner, S. O., & Bhatia, A. K. 2001, ApJ, 553, 421 [NASA ADS] [CrossRef] [Google Scholar]
- Keenan, F. P., Dufton, P. L., Conlon, E. S., et al. 1993, ApJ, 405, 798 [NASA ADS] [CrossRef] [Google Scholar]
- Keenan, F. P., Aggarwal, K. M., Milligan, R. O., et al. 2005, MNRAS, 356, 1592 [NASA ADS] [CrossRef] [Google Scholar]
- Landi, E. 2011, At. Data Nucl. Data Tables, 97, 587 [NASA ADS] [CrossRef] [Google Scholar]
- Landi, E., Young, P. R., Dere, K. P., Zanna, G. D., & Mason, H. E. 2013, ApJ, 763, 86 [NASA ADS] [CrossRef] [Google Scholar]
- Martin, W. C., Sugar, J., Musgrove, A., & Dalton, G. R. 1995, NIST Database for Atomic Spectroscopy, Version 1.0, NIST Standard Reference Data base, 61 [Google Scholar]
- Saraph, H. E. 1972, A&A, 3, 256 [Google Scholar]
- Seaton, M. J. 1961, Proc. Phys. Soc., 77, 174 [NASA ADS] [CrossRef] [Google Scholar]
- Shirai, T., Sugar, J., Musgrove, A., & Wiese, W. L. 2000, J. Phys. Chem. Ref. Data Monograph, 8 (AIP) [Google Scholar]
- Sugar, J., & Corliss, C. 1985, J. Phys. Chem. Ref. Data Suppl., 14 (AIP) [Google Scholar]
- Thomas, R. J., & Neupert, W. M. 1994, ApJS, 91, 461 [NASA ADS] [CrossRef] [Google Scholar]
- Young, P. R., Landi, E., & Thomas, R. J. 1998, A&A, 329, 291 [NASA ADS] [Google Scholar]
All Tables
Electron-impact excitation effective collision strengths for the transition 3s21S0–3p21S0 of Fe14 + at an electron temperature of T = 2.25 × 10⁶ K.
All Figures
|
Fig. 1 Electron-impact excitation collision strength versus the impact energy for the transition 3s21S0–3p21S0 of Fe14 + . Full line: R-matrix (Fernández-Menchero et al. 2014b); ×: AS-DW (Fernández-Menchero et al. 2014b); +: AS-UDW (present work); □: FAC-DW (Landi 2011); ◇: UCL-DW (Christensen et al. 1985). |
| In the text | |
|
Fig. 2 Electron-impact excitation collision strength versus the impact energy for the transition 3s21S0–3p21S0 of S4 +. Full line: R-matrix (Fernández-Menchero et al. 2014b); ×: AS-DW (Fernández-Menchero et al. 2014b); +: AS-UDW (present work); ◇: UCL-DW (Christensen et al. 1986). |
| In the text | |
|
Fig. 3 Emissivity ratio plots for some Fe14 + EUV lines observed by Skylab (above) and SERTS-97 (below). |
| In the text | |
|
Fig. 4 Electron-impact excitation collision strength versus the impact energy for the transition 2s21S0 − 2p21S0 of O4 +. Full line: R-matrix (Fernández-Menchero et al. 2014a); ×: AS-DW (present work); +: AS-UDW (present work). |
| In the text | |
Current usage metrics show cumulative count of Article Views (full-text article views including HTML views, PDF and ePub downloads, according to the available data) and Abstracts Views on Vision4Press platform.
Data correspond to usage on the plateform after 2015. The current usage metrics is available 48-96 hours after online publication and is updated daily on week days.
Initial download of the metrics may take a while.