Fig. 8
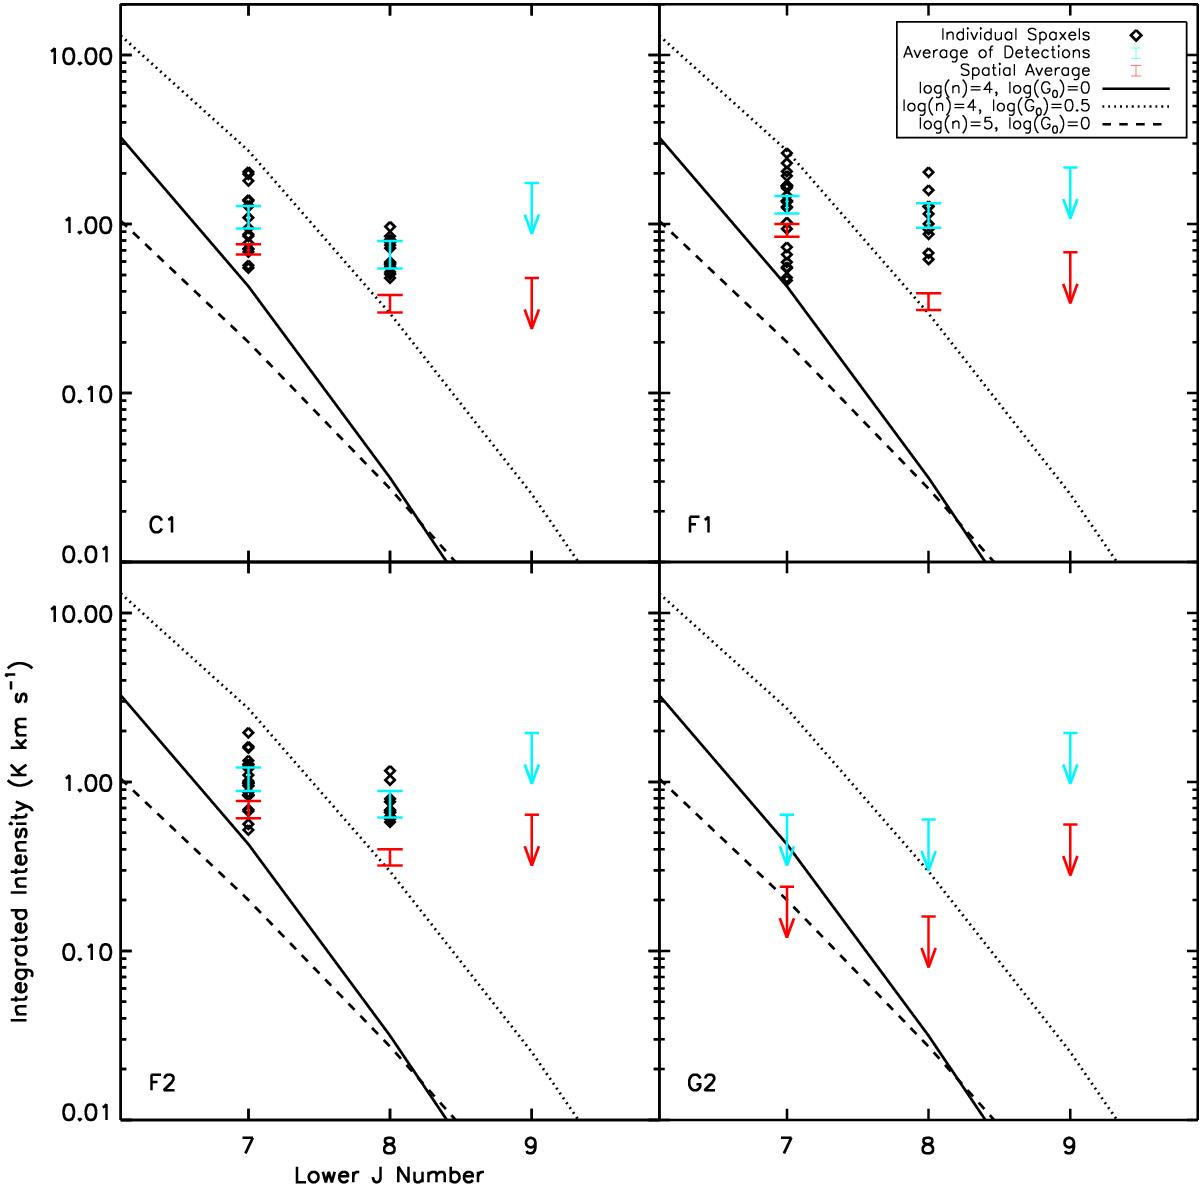
Integrated intensities of various CO rotational transitions as predicted by the Kaufman et al. (1999) PDR models (lines). The solid line is for a PDR model with log (n) = 4 and log (G0) = 0, the dotted line is for log (n) = 4 and log (G0) = 0.5, and the dashed line is for log (n) = 5 and log (G0) = 0. The black diamonds give the integrated intensities from individual pixels. The light blue points are centered on the mean value of all of the detections towards a particular clump and the error bars on these points are sized to the average uncertainty of all single pixel detections, such that the uncertainty in the average integrated intensity detection is much smaller. For maps with no detections, the light blue upper limit instead shows the average upper limit for an individual pixel. The red points show the integrated intensity of the average of all of the spectra across each map, with the error bars showing four times the uncertainty of this integrated intensity. The top left, top right, bottom left, and bottom right panels show the data for the C1, F1, F2, and G2 regions, respectively. Note how none of the PDR models can account for the large observed CO J = 9 → 8 integrated intensities.
Current usage metrics show cumulative count of Article Views (full-text article views including HTML views, PDF and ePub downloads, according to the available data) and Abstracts Views on Vision4Press platform.
Data correspond to usage on the plateform after 2015. The current usage metrics is available 48-96 hours after online publication and is updated daily on week days.
Initial download of the metrics may take a while.