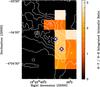
Fig. 7
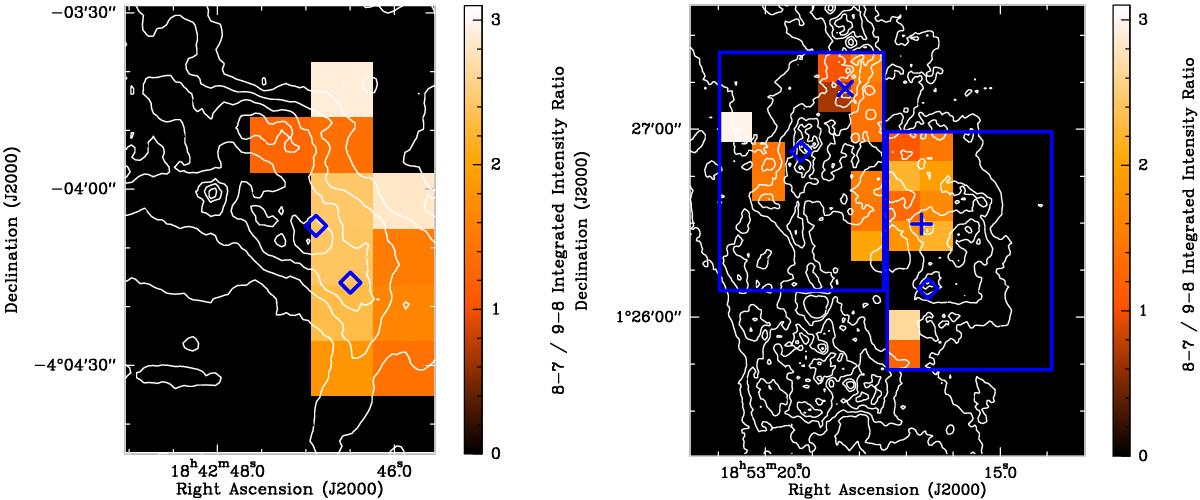
Ratios of the integrated intensities of the CO J = 8 → 7 to 9 → 8 lines for locations where both lines are detected are shown in the colour scale. The left panel shows the C1 clump while the right panel shows the F1 and F2 clumps. The contours are mass surface density from Butler & Tan (2012), with the contours starting at 0.075 g cm-2 and increasing by increments of 0.075 g cm-2. The blue diamonds are the locations of the C1-N, C1-S, F1, and F2 cores. See Fig. 1 for the labels of these cores. The cross gives the location of the 24 micron source associated with the F1 clump (Chambers et al. 2009) and the “X” gives the location of the Rathborne et al. (2006) MM7 clump. The large blue rectangles denote the area surveyed with Herschel.
Current usage metrics show cumulative count of Article Views (full-text article views including HTML views, PDF and ePub downloads, according to the available data) and Abstracts Views on Vision4Press platform.
Data correspond to usage on the plateform after 2015. The current usage metrics is available 48-96 hours after online publication and is updated daily on week days.
Initial download of the metrics may take a while.