Fig. 6
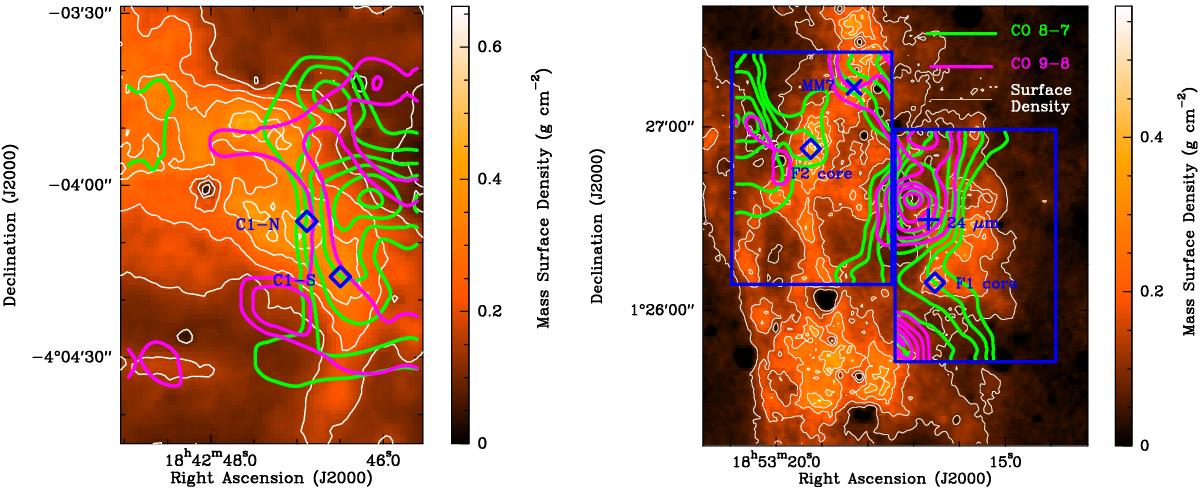
Integrated intensities of the CO J = 8 → 7 (green) and CO J = 9 → 8 (purple) lines are shown as the thick contours. The left panel shows the C1 clump while the right panel shows the F1 and F2 clumps. The contours start at four times the average uncertainty and increase in increments of two times the average uncertainty (see Col. 9 of Table 3). For the right panel, the average uncertainty for each line was taken as the average value of Ilim between the F1 and F2 maps. The colour scale and thin white contours are mass surface density from Butler & Tan (2012), with the contours starting at 0.075 g cm-2 and increasing by increments of 0.075 g cm-2. The blue diamonds are the locations of the C1-N, C1-S, F1, and F2 cores. The cross gives the location of the 24 micron source associated with the F1 clump (Chambers et al. 2009) and the “X” gives the location of the Rathborne et al. (2006) MM7 clump. The large blue rectangles on the right panel denote the area surveyed with Herschel, while the left panel shows the entire Herschel survey region around the C1 clump.
Current usage metrics show cumulative count of Article Views (full-text article views including HTML views, PDF and ePub downloads, according to the available data) and Abstracts Views on Vision4Press platform.
Data correspond to usage on the plateform after 2015. The current usage metrics is available 48-96 hours after online publication and is updated daily on week days.
Initial download of the metrics may take a while.