Fig. 4
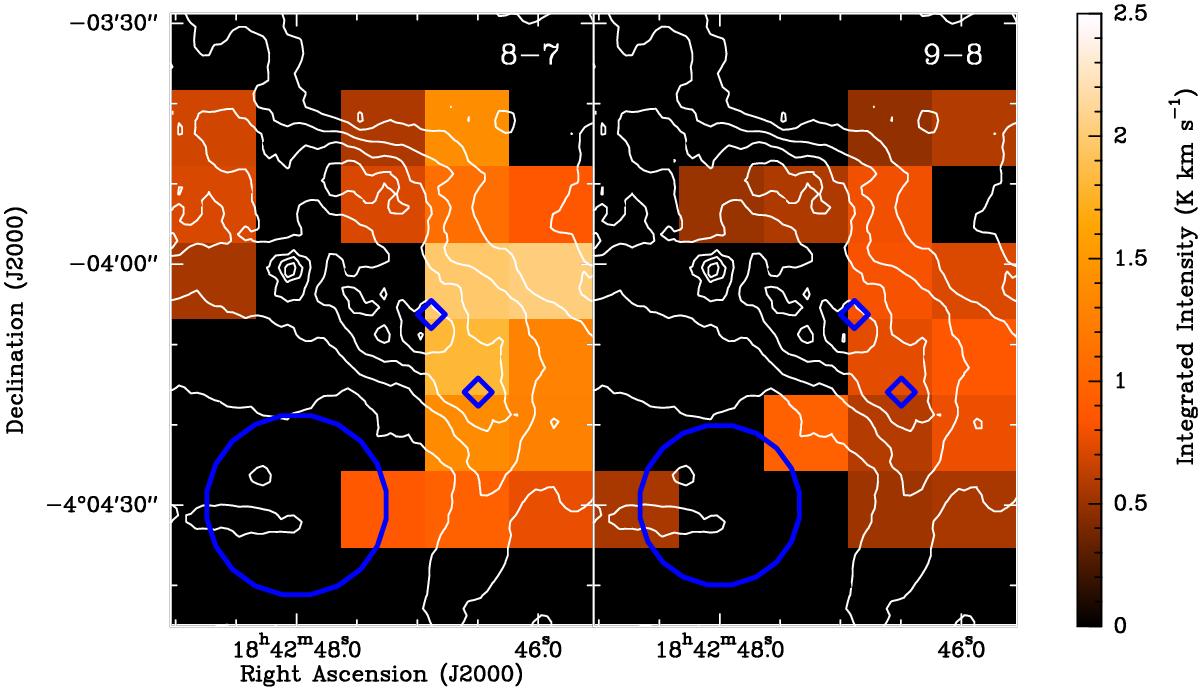
Integrated intensities of the CO J = 8 → 7 (left) and CO J = 9 → 8 (right) lines towards the C1 clump are shown in the colour scale. The contours are mass surface density from Butler & Tan (2012), with the contours starting at 0.075 g cm-2 and increasing by increments of 0.075 g cm-2. The blue diamonds are the locations of the C1-N and C1-S cores, with the top left core being C1-N. The blue circles have diameters equal to the half power beam width of the Herschel beams.
Current usage metrics show cumulative count of Article Views (full-text article views including HTML views, PDF and ePub downloads, according to the available data) and Abstracts Views on Vision4Press platform.
Data correspond to usage on the plateform after 2015. The current usage metrics is available 48-96 hours after online publication and is updated daily on week days.
Initial download of the metrics may take a while.