Fig. 1
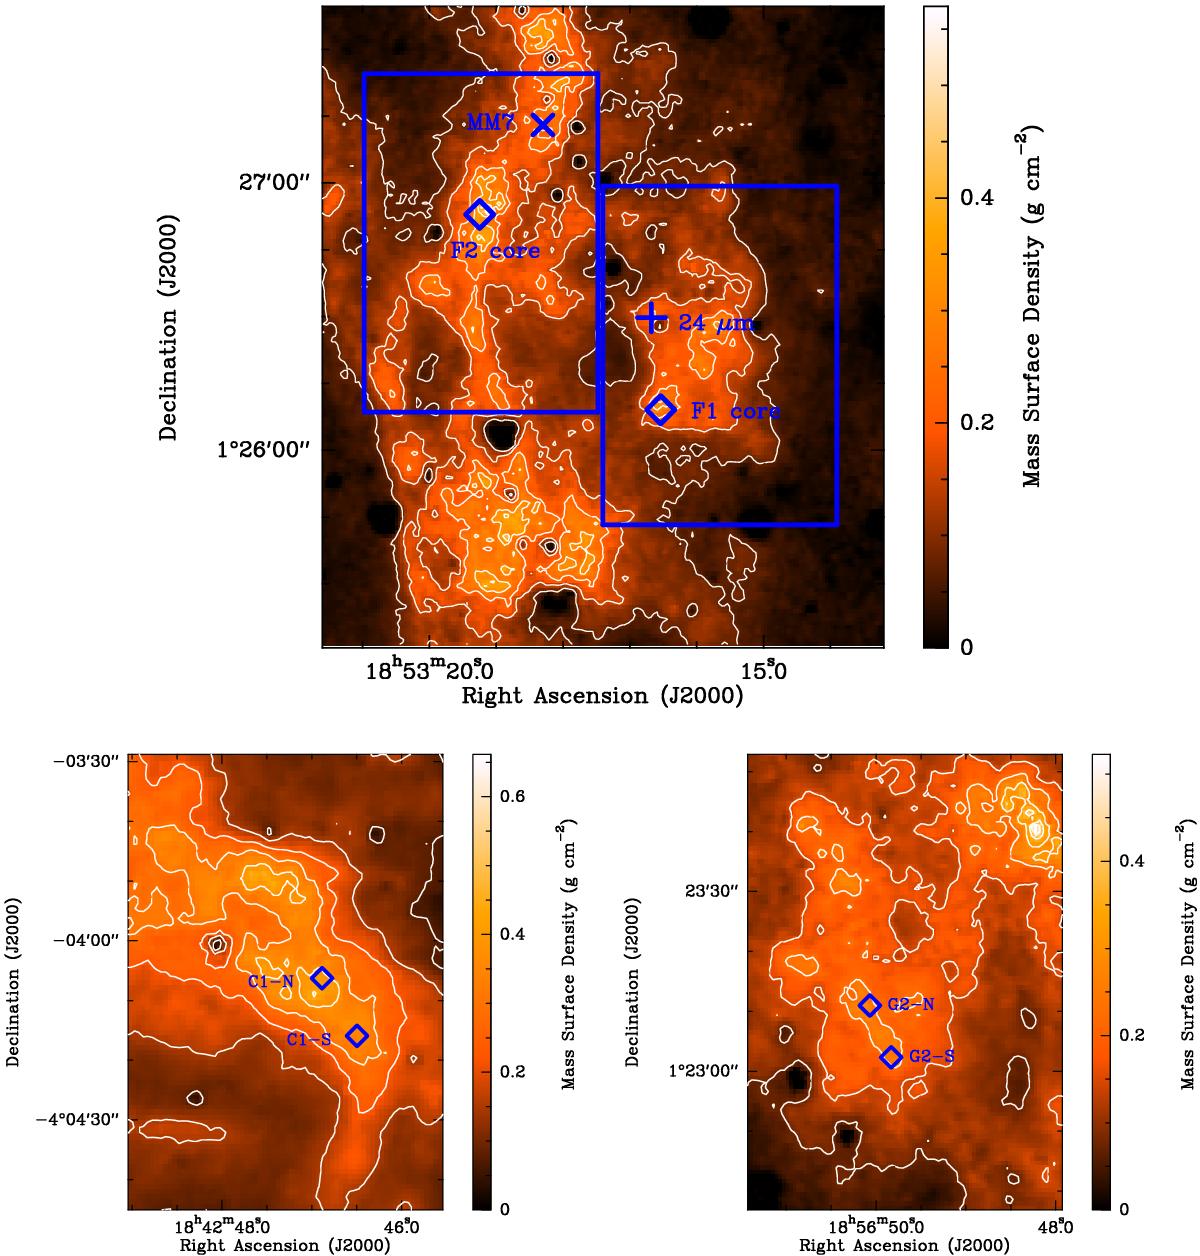
Mass surface density derived by Butler & Tan (2012). The top, bottom left, and bottom right panels show IRDCs F, C, and G, respectively. The contours start at 0.075 g cm-2 (AV of 17 mag) and increase by increments of 0.075 g cm-2. The blue diamonds give the central locations of the cores as seen in N2D+ emission (Tan et al. 2013). The regions shown in the bottom two panels (IRDCs C and G) are the regions mapped by Herschel in the CO J = 9→ 8 line. The large blue rectangles in the top panel (IRDC F) show the areas mapped by Herschel in the CO J = 9→ 8 line for the F1 and F2 clumps. In the bottom left panel, the mass surface density hole near 18h:42m:48.0s, –4°:04′:00′′ is due to the presence of an 8 micron source at this location preventing a reliable mass surface density from being determined from the extinction of the 8 micron Galactic background (Butler et al. 2014). Such mass surface density holes, corresponding to locations of other 8 micron sources, can be seen in the other maps. In the top panel, the cross gives the location of the 24 micron source associated with the F1 clump (Chambers et al. 2009) and the “X” gives the location of the Rathborne et al. (2006) MM7 clump.
Current usage metrics show cumulative count of Article Views (full-text article views including HTML views, PDF and ePub downloads, according to the available data) and Abstracts Views on Vision4Press platform.
Data correspond to usage on the plateform after 2015. The current usage metrics is available 48-96 hours after online publication and is updated daily on week days.
Initial download of the metrics may take a while.