Fig. 2
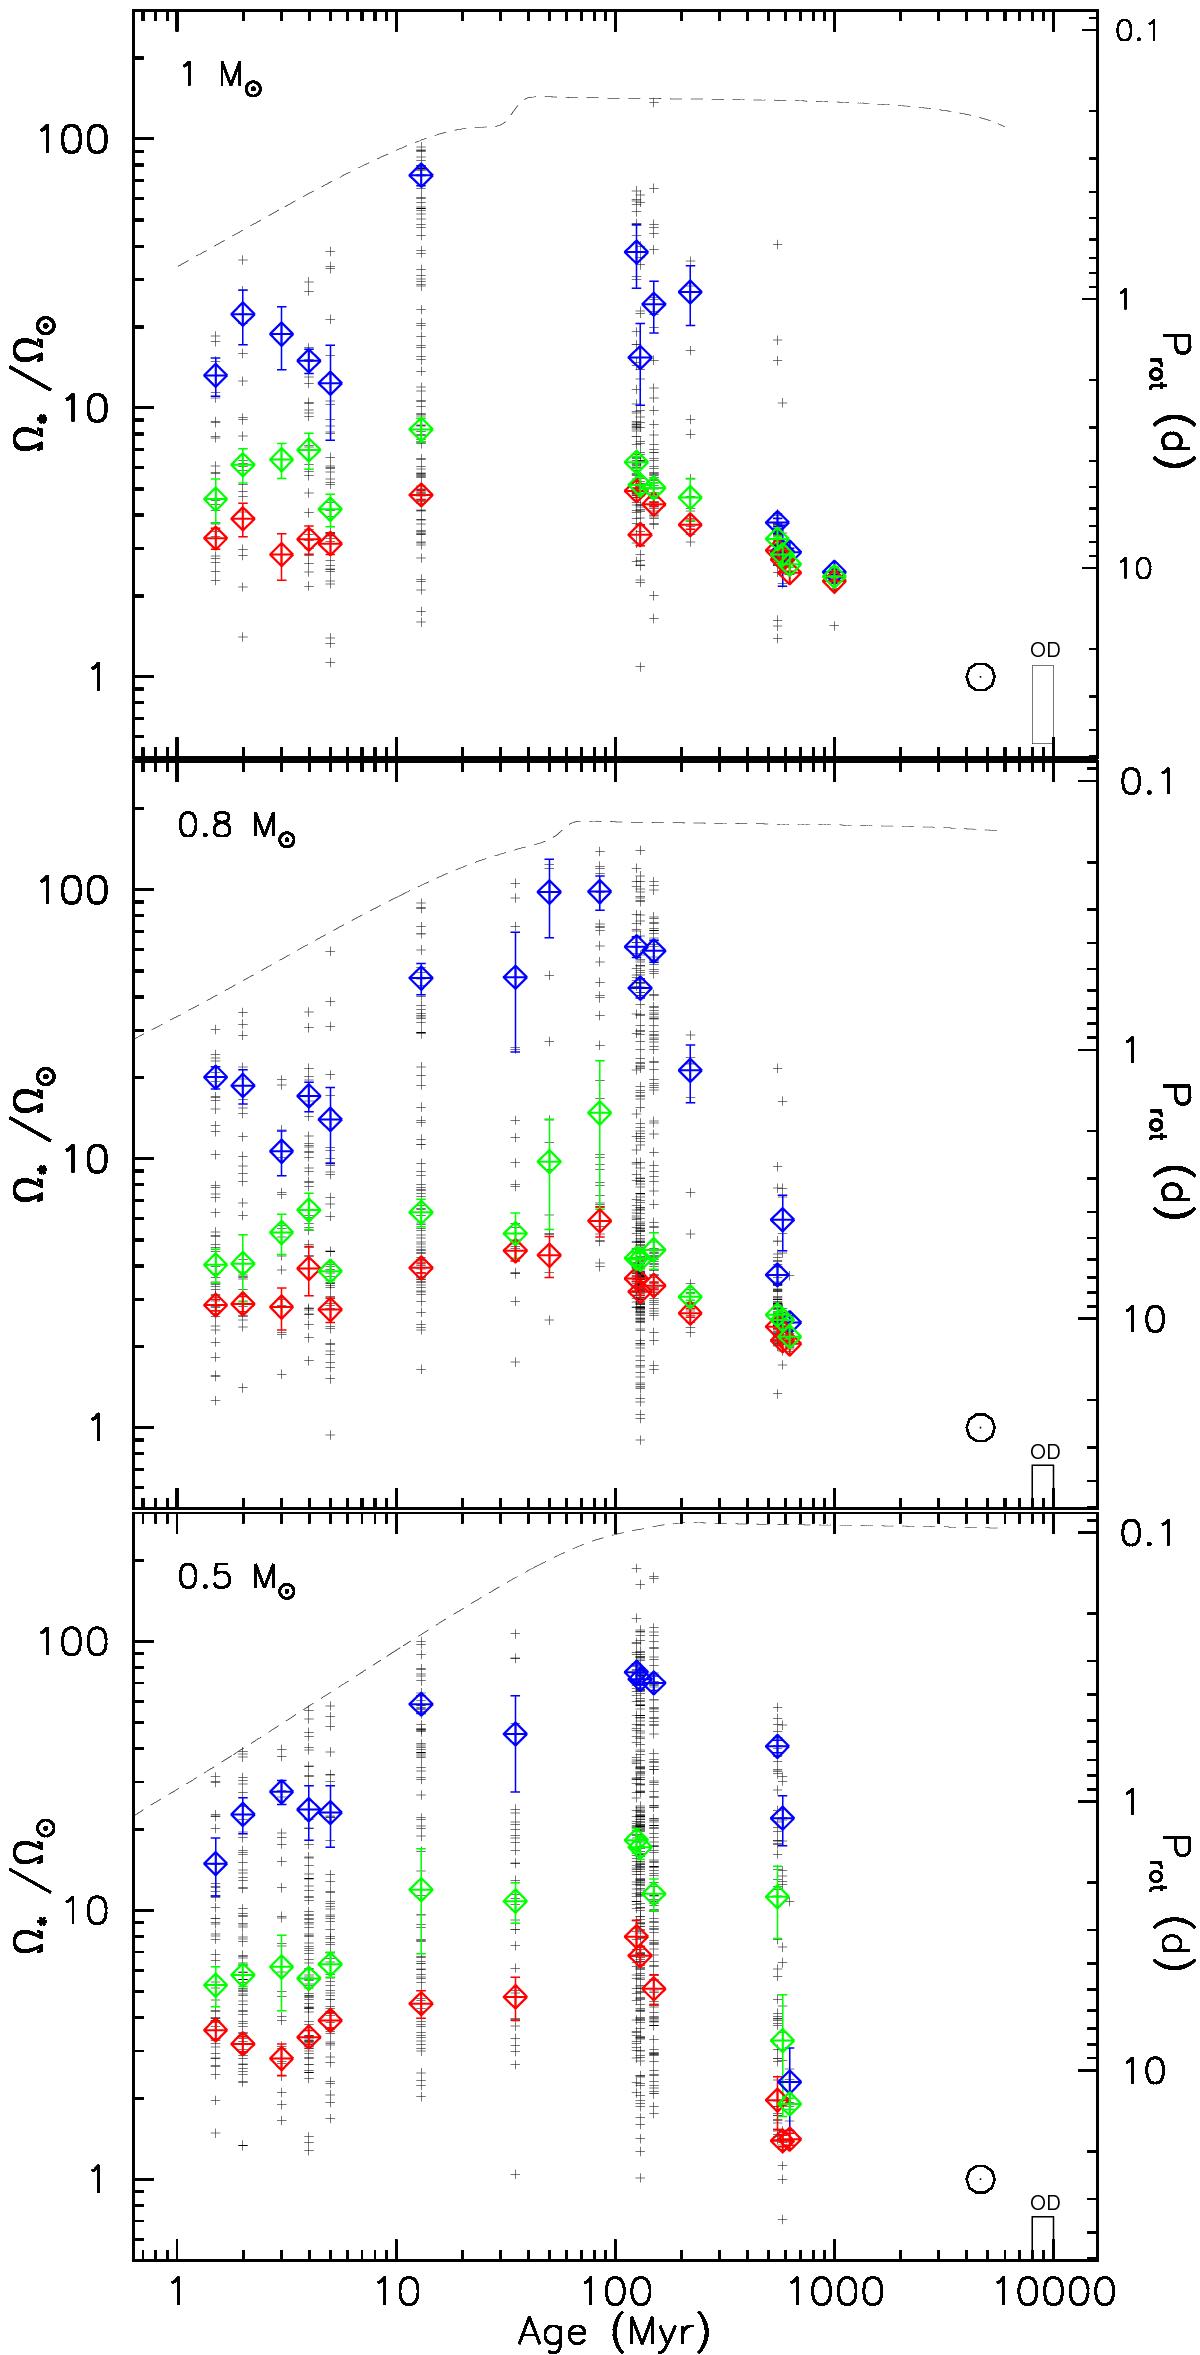
Angular velocity distributions are plotted as a function of time for low-mass stars in star-forming regions and young open clusters. Each panel covers a different mass bin: 0.9−1.1 M⊙ (upper panel), 0.7−0.9 M⊙ (middle panel), 0.4−0.6 M⊙ (lower panel). The red, green, and blue tilted squares and associated error bars represent the 25th, 50th, and 90th rotational percentiles, respectively. The open circle shows the angular velocity of the present Sun for reference. The black rectangle labelled OD (lower right corner of each panel) shows the angular velocity dispersion of old disk field stars. The black dashed line represents the evolution of break-up velocity. The left vertical axis is labelled with angular velocities normalised to the Sun’s, while the right vertical axis is labelled with rotational periods (days).
Current usage metrics show cumulative count of Article Views (full-text article views including HTML views, PDF and ePub downloads, according to the available data) and Abstracts Views on Vision4Press platform.
Data correspond to usage on the plateform after 2015. The current usage metrics is available 48-96 hours after online publication and is updated daily on week days.
Initial download of the metrics may take a while.