Fig. 6
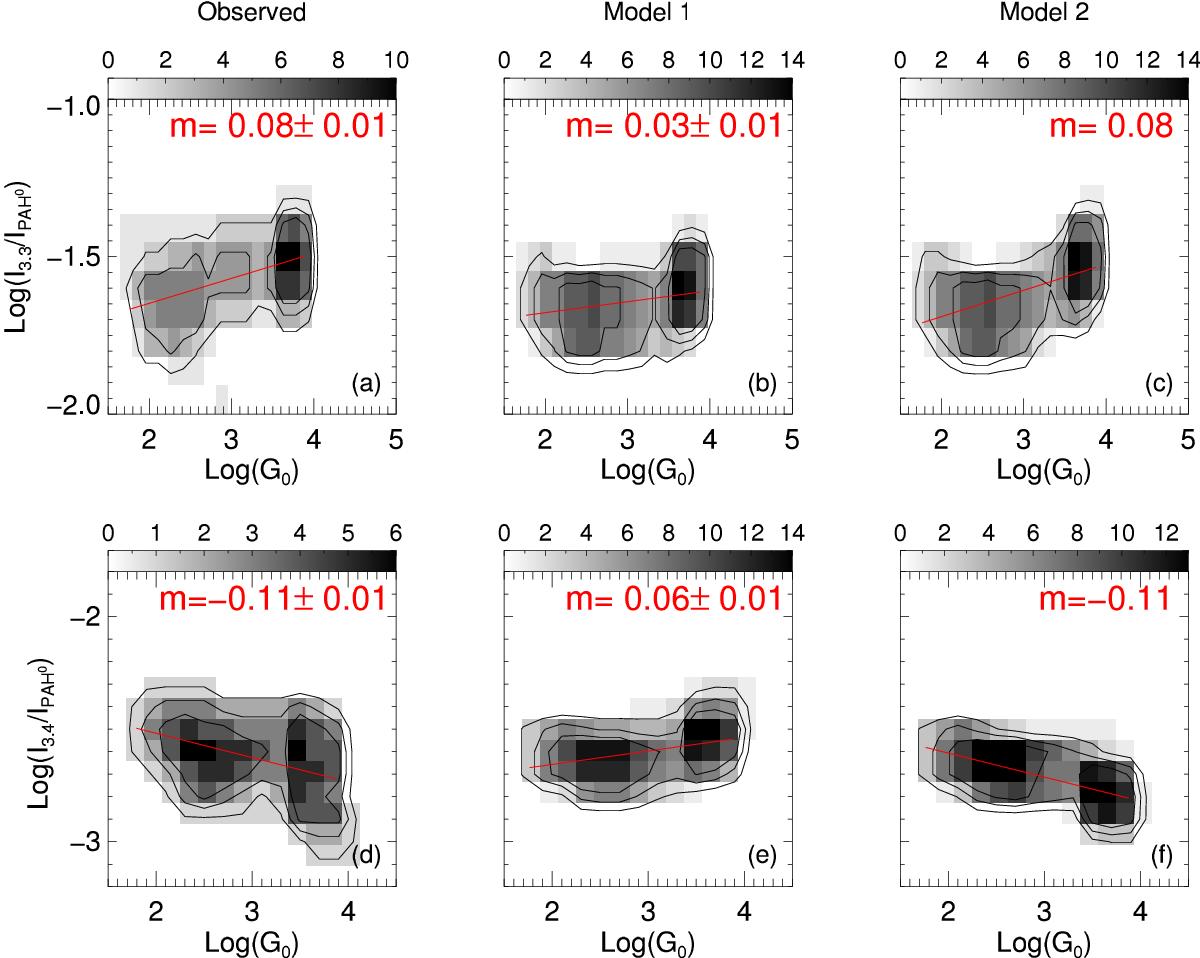
First column: correlation between the observed I3.3/IPAH0 and I3.4/IPAH0 as a function of G0. Second column: same plots for model maps of I3.3/IPAH0 and I3.4/IPAH0 computed using Eqs. (6) and (8) and the obtained values for IPAH+/IPAH0 (see text for details). Third column: semi-empirical model that in addition includes the dependency with G0 on the intensity at 3.3 and 3.4 μm relative to all PAH0 bands (see text). In all panels, the linear fit to the data points (red line) is shown as well as its slope m.
Current usage metrics show cumulative count of Article Views (full-text article views including HTML views, PDF and ePub downloads, according to the available data) and Abstracts Views on Vision4Press platform.
Data correspond to usage on the plateform after 2015. The current usage metrics is available 48-96 hours after online publication and is updated daily on week days.
Initial download of the metrics may take a while.