Fig. 5
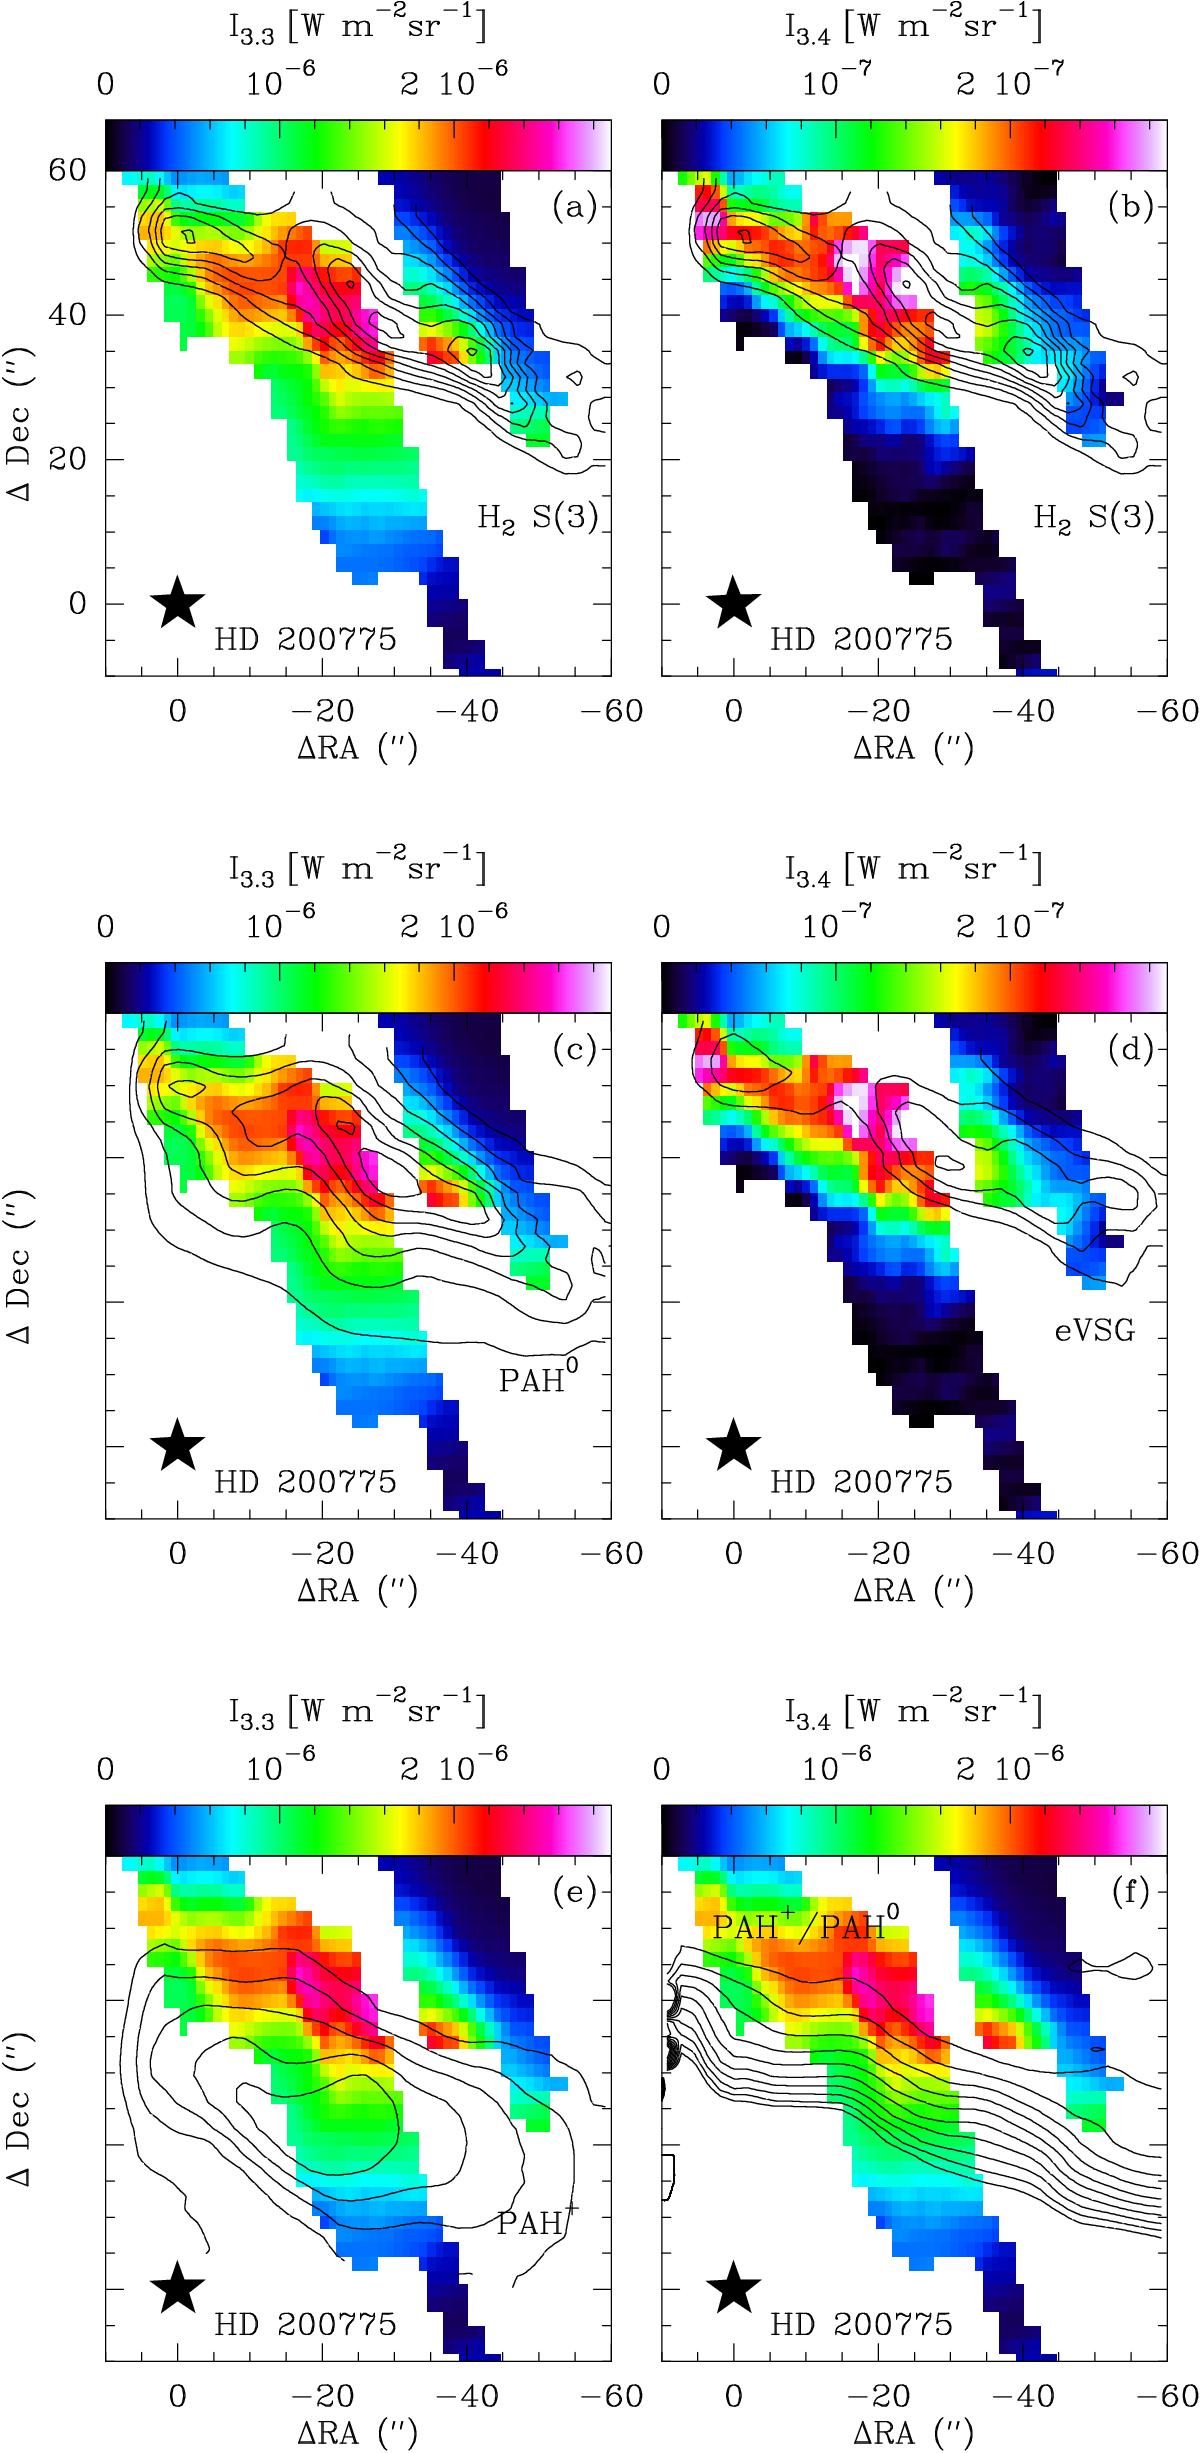
Top: spatial distribution of the 3.3 μma) and 3.4 μmb) integrated intensity as observed by the IRC instrument (color scale). The contours represent the integrated intensity of the H2 S(3) line at 9.7 μm (linear steps of 1.7 × 10⁻⁷ W m-2 sr-1), and the star indicates the position of HD 200775. Middle: comparison of the integrated intensity of the bands at 3.3 and 3.4 μm (color scale) with the spatial distribution of the PAH0 and eVSG intensity, respectively (contours steps of 1.7 × 10⁻⁵ W m2 sr-1, starting at 1.7 × 10⁻⁵ W m2 sr-1). Bottom: comparison of the integrated intensity of the 3.3 μm band with that of PAH+ and with the ratio IPAH+/IPAH0. In f) the contours are shown in steps of 0.3, with increasing values while approaching the star from the PDR.
Current usage metrics show cumulative count of Article Views (full-text article views including HTML views, PDF and ePub downloads, according to the available data) and Abstracts Views on Vision4Press platform.
Data correspond to usage on the plateform after 2015. The current usage metrics is available 48-96 hours after online publication and is updated daily on week days.
Initial download of the metrics may take a while.