Fig. 4
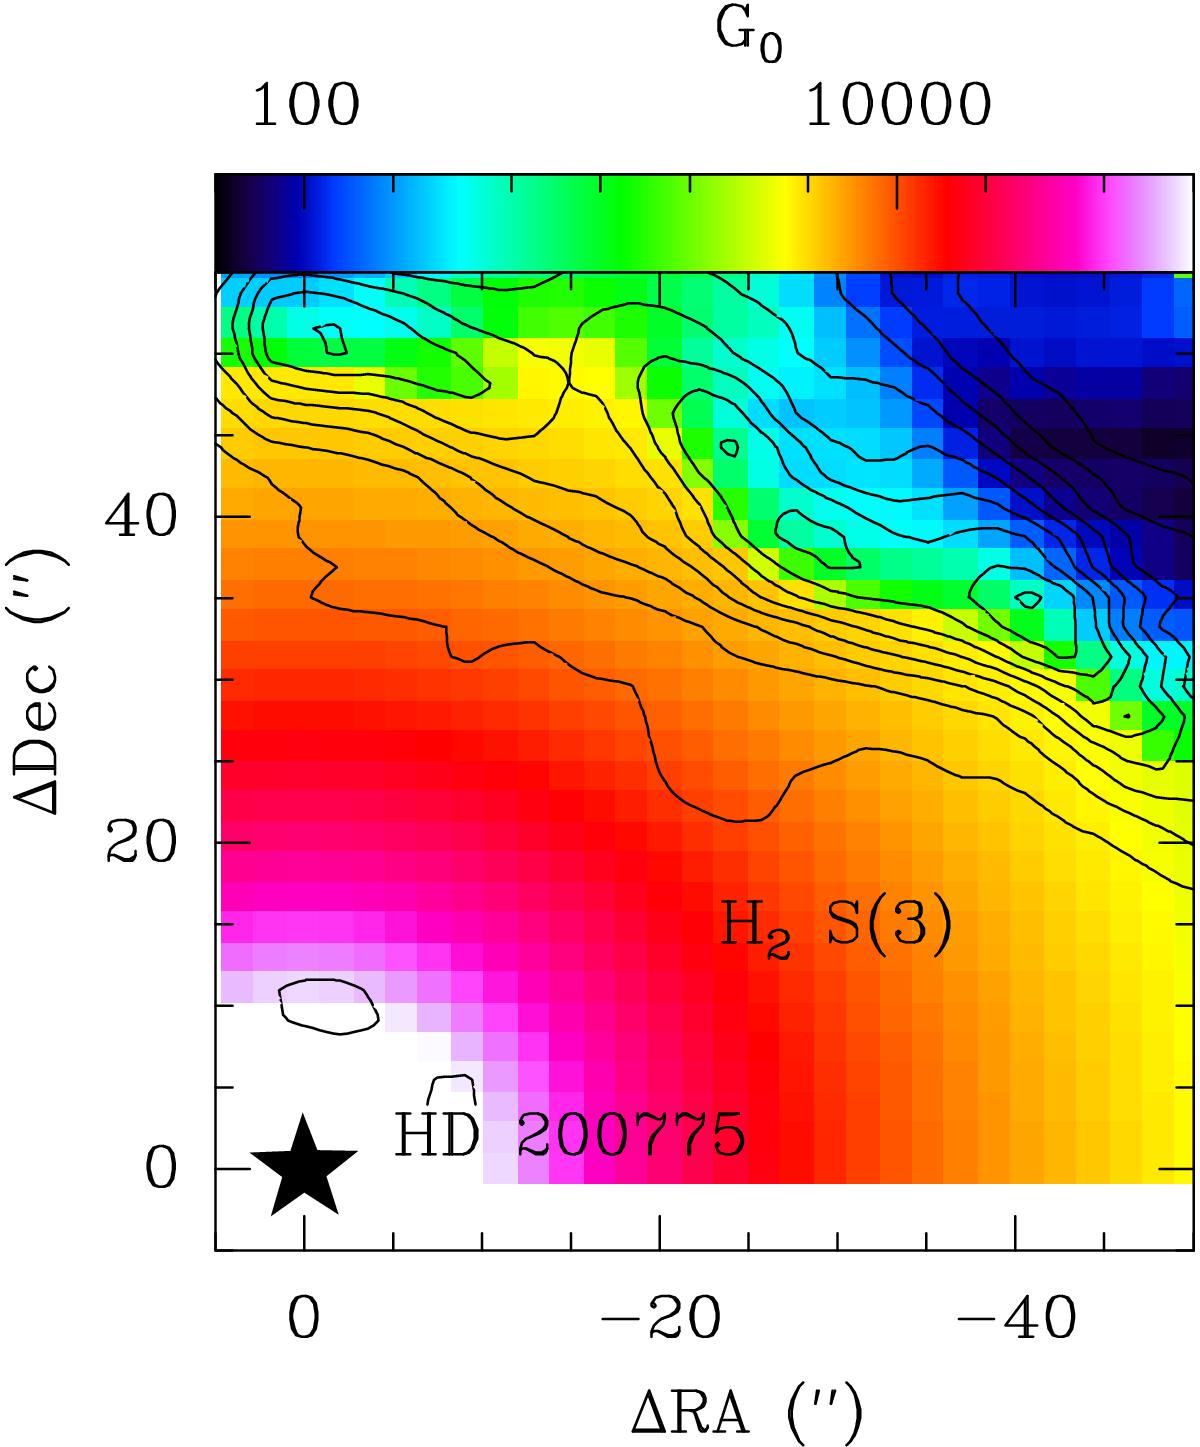
Map of G0 in NGC 7023 NW (color scale). The H2 S(3) integrated intensity is shown for reference (linear steps of 1.7 × 10⁻⁷ W m-2 sr-1). The values of G0 between the star and the PDR were obtained assuming geometrical dilution of the stellar radiation field and a local extinction value of AV = 1.5. Inside the PDR, we used the fraction of carbon locked in eVSG as a probe for G0 (Pilleri et al. 2012).
Current usage metrics show cumulative count of Article Views (full-text article views including HTML views, PDF and ePub downloads, according to the available data) and Abstracts Views on Vision4Press platform.
Data correspond to usage on the plateform after 2015. The current usage metrics is available 48-96 hours after online publication and is updated daily on week days.
Initial download of the metrics may take a while.