Fig. 3
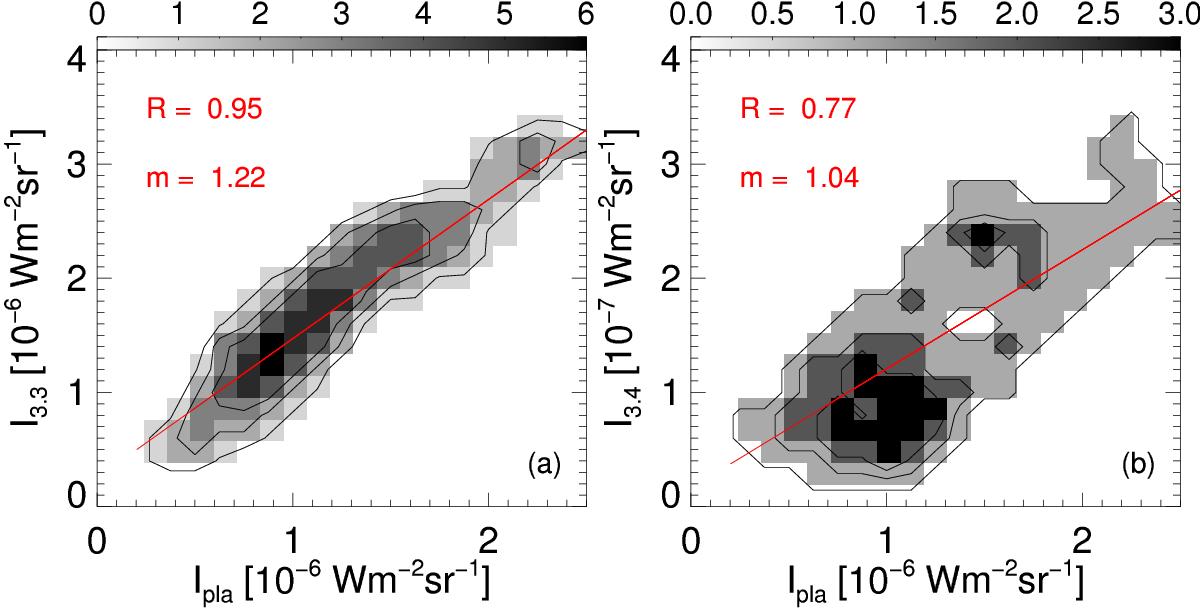
Pixel-to-pixel correlations of the integrated intensity of the 3.3 μm band (I3.3), 3.4 μm band (I3.4), and the 3.45 μm plateau (Ipla). The correlation coefficient R and the slope m of the linear fit to the points are also given. Ipla correlates better with the intensity of the aromatic 3.3 μm band than with the aliphatic 3.4 μm band. This indicates that the plateau is dominated by emission from aromatic bonds.
Current usage metrics show cumulative count of Article Views (full-text article views including HTML views, PDF and ePub downloads, according to the available data) and Abstracts Views on Vision4Press platform.
Data correspond to usage on the plateform after 2015. The current usage metrics is available 48-96 hours after online publication and is updated daily on week days.
Initial download of the metrics may take a while.