Fig. 2
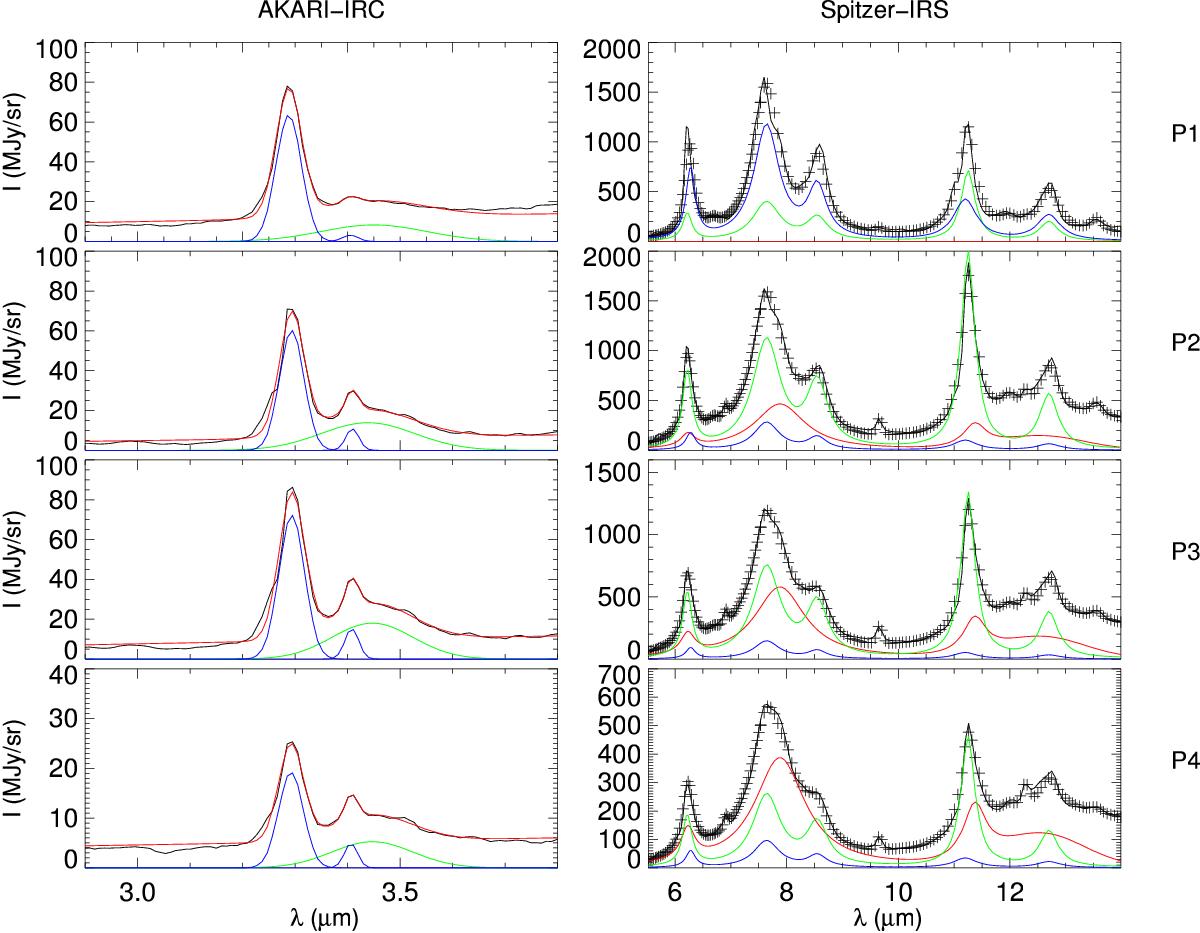
Summary of the observations and spectral analysis for positions P1 to P4 (top to bottom row). First column: the observed spectrum (black) and its fit (red) for the AKARI observations. The fit of the 3.29 and 3.40 μm features are displayed in blue, and the 3.45 μm plateau is shown in green. Second column: observed Spitzer-IRS spectrum (crosses), its fit (black) and the decomposition obtained with PAHTAT (red: eVSG, green: PAH0, blue: PAH+).
Current usage metrics show cumulative count of Article Views (full-text article views including HTML views, PDF and ePub downloads, according to the available data) and Abstracts Views on Vision4Press platform.
Data correspond to usage on the plateform after 2015. The current usage metrics is available 48-96 hours after online publication and is updated daily on week days.
Initial download of the metrics may take a while.