Fig. 1
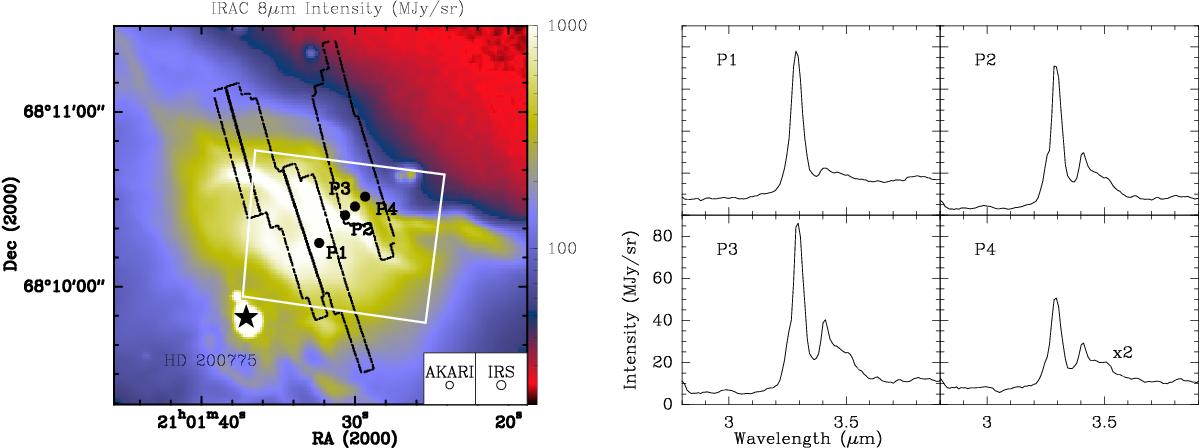
In color scale, the Spitzer IRAC 8 μm image of the NGC 7023 NW PDR (Werner et al. 2004). The dark lines demarcate the region in which AKARI-IRC data were obtained, the white rectangle represents the Spitzer-IRS field of view. The star represents the position of HD 200775. The insets represent the AKARI and IRS beam sizes. AKARI spectra between 2.8 and 3.9 μm are shown to the right. They correspond to the positions P1-P4 that are marked as black dots on the map.
Current usage metrics show cumulative count of Article Views (full-text article views including HTML views, PDF and ePub downloads, according to the available data) and Abstracts Views on Vision4Press platform.
Data correspond to usage on the plateform after 2015. The current usage metrics is available 48-96 hours after online publication and is updated daily on week days.
Initial download of the metrics may take a while.