Fig. 9
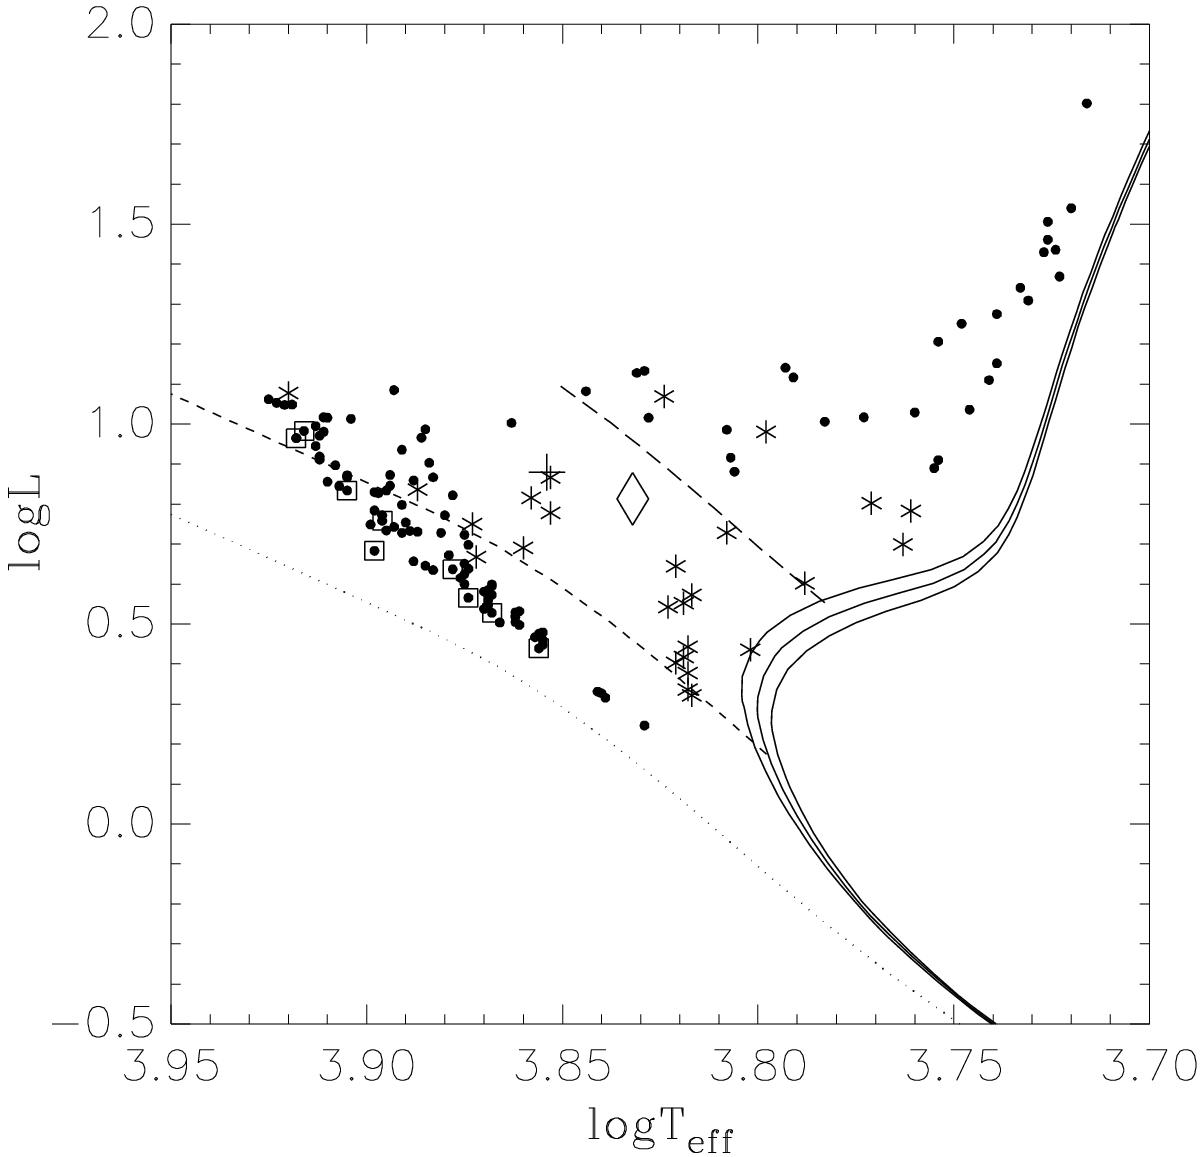
Collective HR diagram of all mergers (filled circles) and all binary BS (asterisks) from Figs. 6−8, together with the corresponding isochrones. Rapidly rotating mergers are additionally marked with squares. The position of the eclipsing binary V60 from M55 and of the model 0.89+0.8(1.9) are plotted as a diamond and a plus sign. The ZAMS and the blue boundary of the binary BS region determined by Tian et al. (2006) are shown as a dotted and broken line. Long dashes mark the adopted red boundary of the BS region.
Current usage metrics show cumulative count of Article Views (full-text article views including HTML views, PDF and ePub downloads, according to the available data) and Abstracts Views on Vision4Press platform.
Data correspond to usage on the plateform after 2015. The current usage metrics is available 48-96 hours after online publication and is updated daily on week days.
Initial download of the metrics may take a while.