Fig. 6
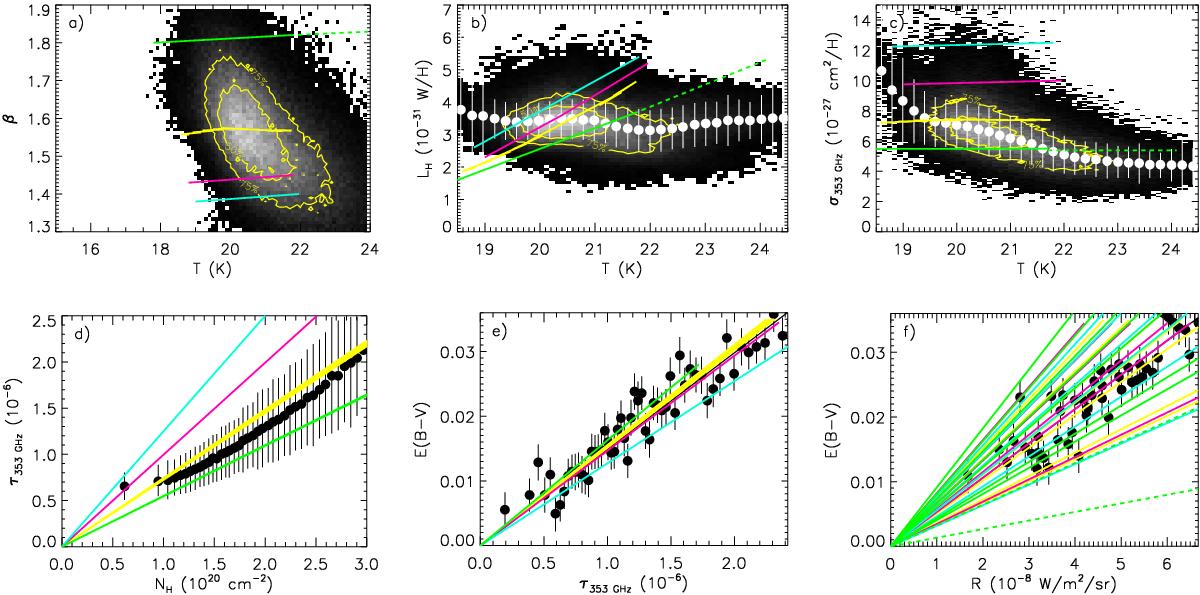
Influence of the carbon abundance (for carbonaceous grains with a 10 nm thick aromatic mantle and silicates with a 5 nm aromatic mantle). The solid yellow lines show the model with the standard carbon abundance of Jones et al. (2013), the solid pink lines with an extra 60 ppm in both the small and big carbonaceous grains, and the solid turquoise lines with an extra 120 ppm in the big carbonaceous grains only. The solid green lines show the results for the case, where only 12 ppm of carbon are included in the big carbonaceous grains (see Sect. 4.3 for details). The radiation field is varied with ![]() . The dashed green lines present the results for the same carbon abundance as the solid green lines but for
. The dashed green lines present the results for the same carbon abundance as the solid green lines but for ![]() . See Sect. 2.2 for description of the black and white lines and symbols.
. See Sect. 2.2 for description of the black and white lines and symbols.
Current usage metrics show cumulative count of Article Views (full-text article views including HTML views, PDF and ePub downloads, according to the available data) and Abstracts Views on Vision4Press platform.
Data correspond to usage on the plateform after 2015. The current usage metrics is available 48-96 hours after online publication and is updated daily on week days.
Initial download of the metrics may take a while.