Fig. 1
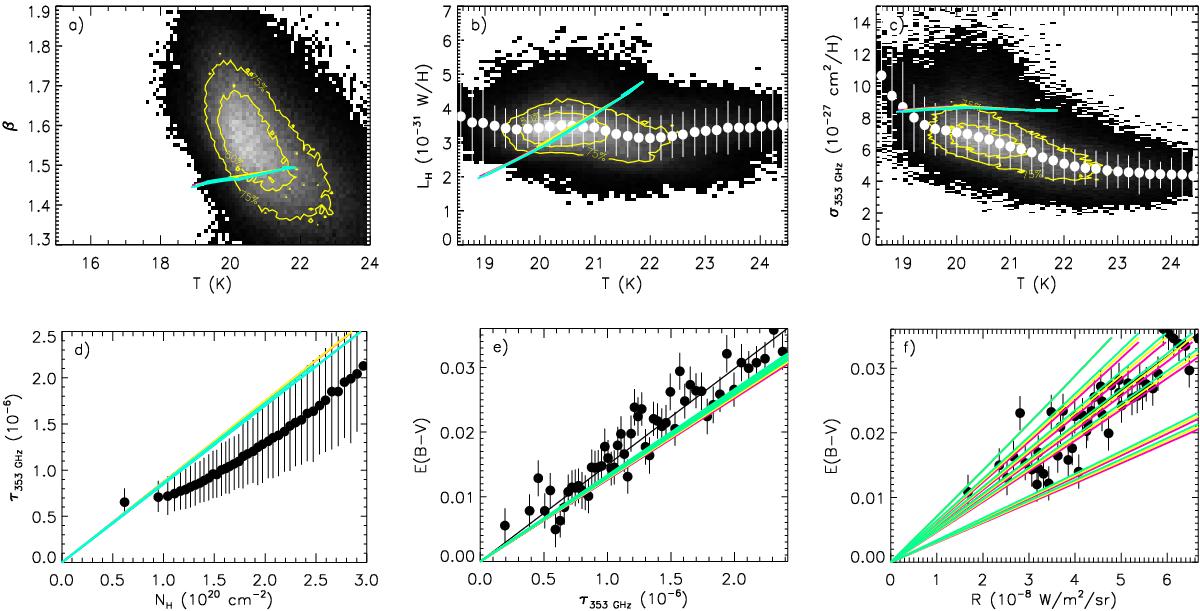
Influence of the density distribution in the local ISM (silicates with a 5 nm thick mantle and carbons with a 20 nm thick mantle). Cold neutral medium (CNM) with nH = 25 to 70 H/cm3 is shown in pink, CNM with nH = 100 H/cm3 surrounded by Warm Neutral Medium (WNM) with nH = 1 H/cm3 is plotted in yellow, and WNM with nH = 1 H/cm3 is displayed in turquoise. The three models overlap in the figures. The radiation field is also varied with ![]() . In panels d), e), and f), seven lines of the same colour are plotted. Each of these lines corresponds to a different value of G0. For instance, in panel f), the turquoise lines from left to right correspond to G0 = 0.8, 0.9, 1.0, 1.1, 1.2, 1.3, and 1.4, respectively. The models falling below the observed E(B − V) to ℛ ratio are those illuminated by an ISRF scaled with G0 = 1.3 and 1.4. See Sect. 2.2 for description of the black and white lines and symbols.
. In panels d), e), and f), seven lines of the same colour are plotted. Each of these lines corresponds to a different value of G0. For instance, in panel f), the turquoise lines from left to right correspond to G0 = 0.8, 0.9, 1.0, 1.1, 1.2, 1.3, and 1.4, respectively. The models falling below the observed E(B − V) to ℛ ratio are those illuminated by an ISRF scaled with G0 = 1.3 and 1.4. See Sect. 2.2 for description of the black and white lines and symbols.
Current usage metrics show cumulative count of Article Views (full-text article views including HTML views, PDF and ePub downloads, according to the available data) and Abstracts Views on Vision4Press platform.
Data correspond to usage on the plateform after 2015. The current usage metrics is available 48-96 hours after online publication and is updated daily on week days.
Initial download of the metrics may take a while.