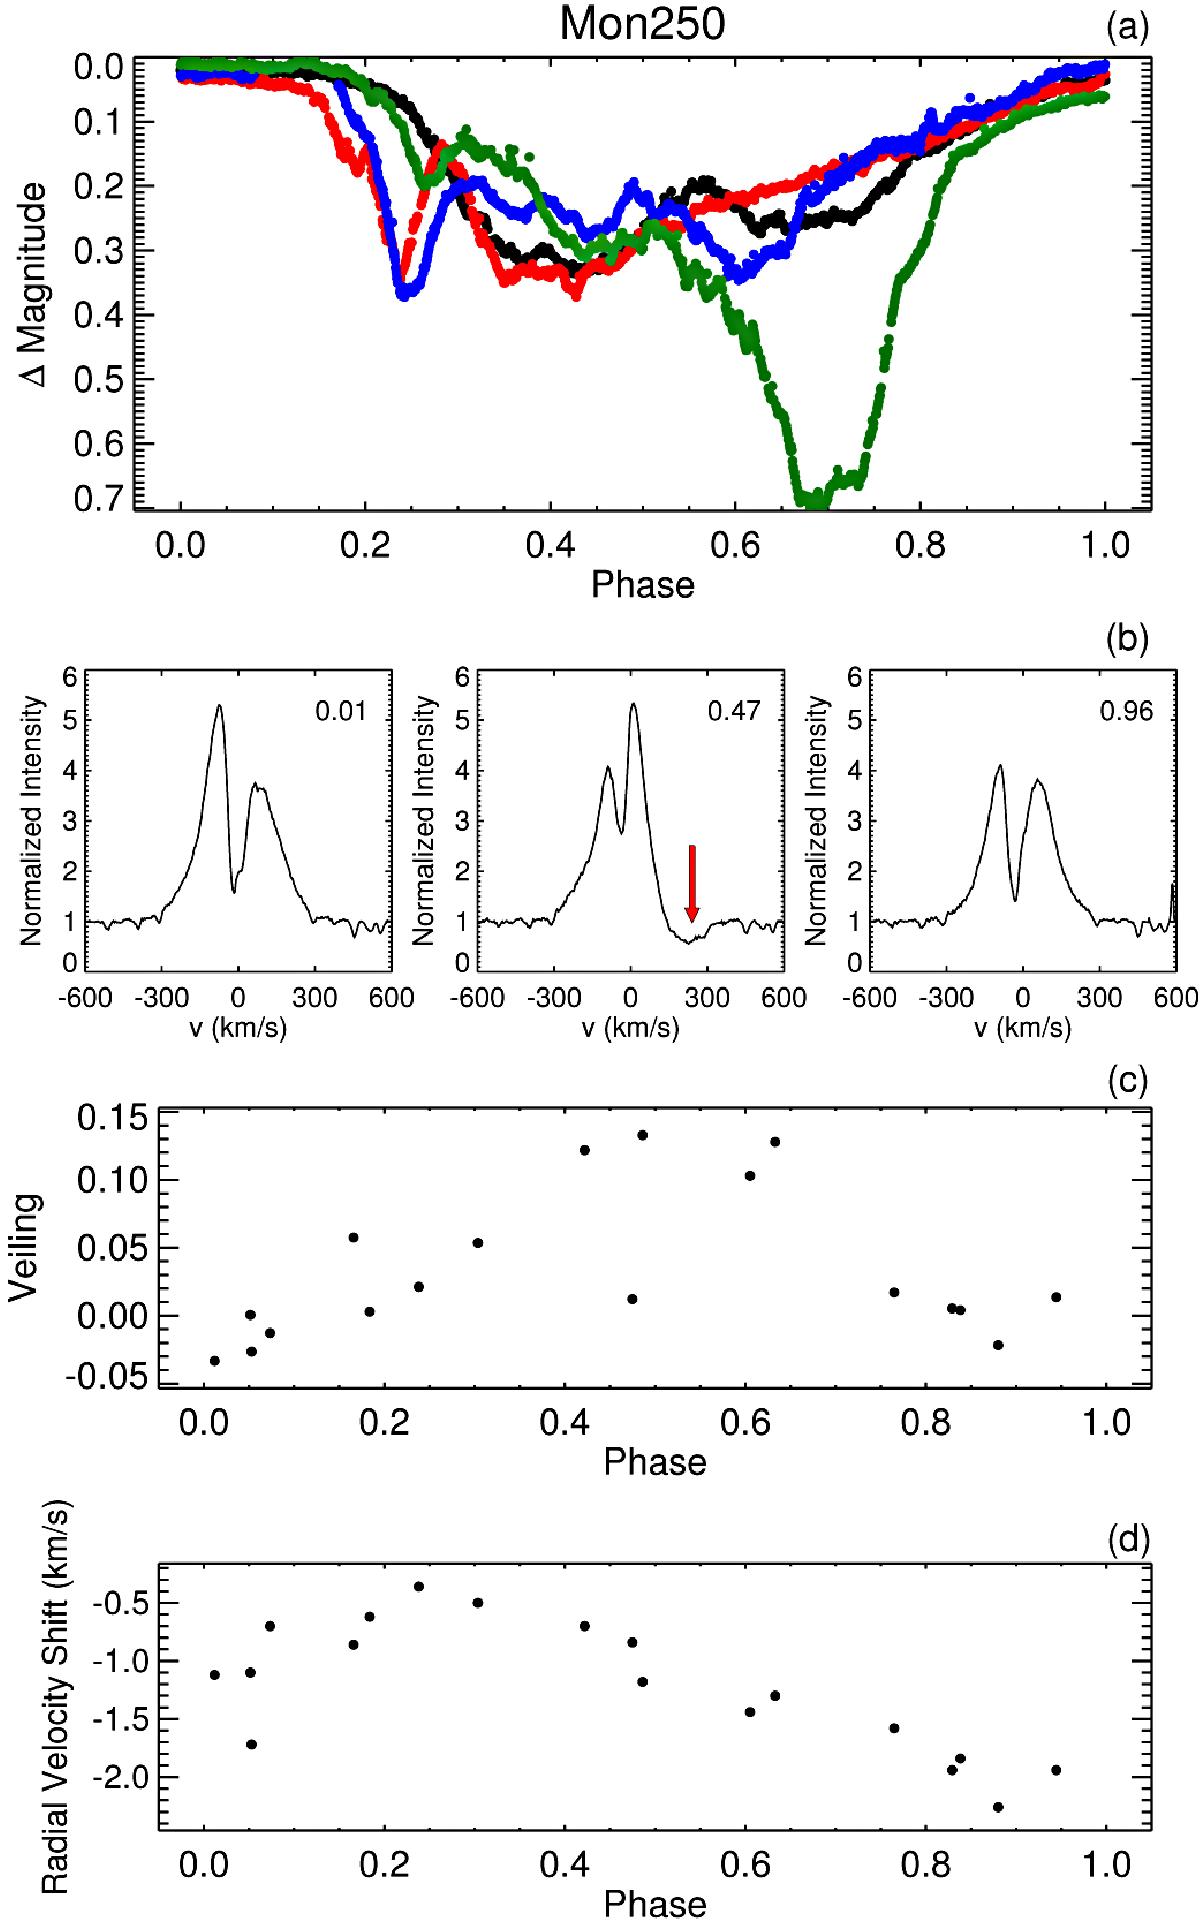
Fig. 7
Mon-250. a) 2011 CoRoT light curve folded in phase. b) Hα line profile during different rotational phases, indicated in each panel. A redshifted absorption component seen only near phase 0.5 is indicated by a red arrow. c) Measured veiling folded in phase. d) Shift in radial velocity measured from photospheric lines in the spectra, folded in phase. In all four panels, the same period of 8.6 days, determined from the radial velocity variation of photospheric lines, was used to calculate the phase. The same initial date was also used.
Current usage metrics show cumulative count of Article Views (full-text article views including HTML views, PDF and ePub downloads, according to the available data) and Abstracts Views on Vision4Press platform.
Data correspond to usage on the plateform after 2015. The current usage metrics is available 48-96 hours after online publication and is updated daily on week days.
Initial download of the metrics may take a while.