Fig. 3
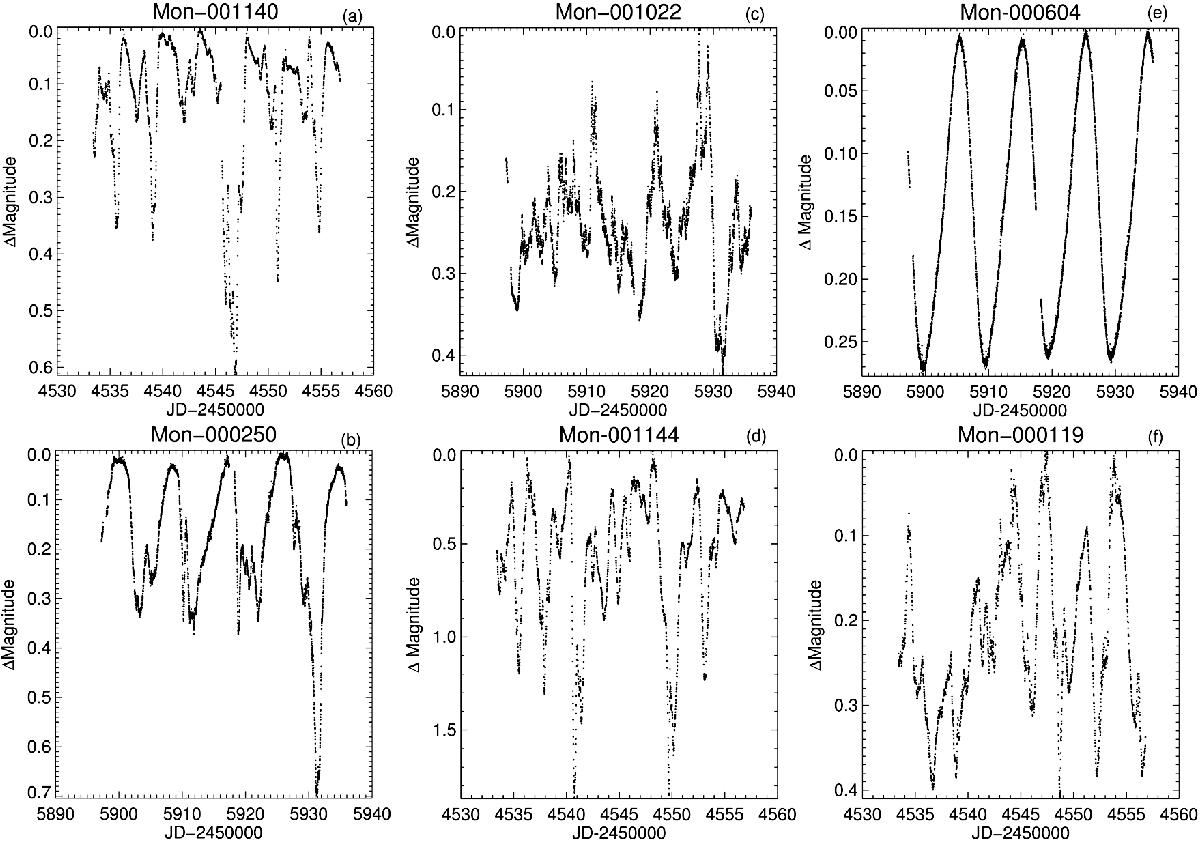
Examples of different light curve morphologies found in CTTS in NGC 2264. a) and b) show periodic light curves attributed to circumstellar extinction, c) shows an accretion burst dominated light curve, d) shows a light curve dominated by aperiodic extinction, e) shows a spot-like light curve, and f) shows a light curve whose morphology is very complex, probably as a result of a combination of processes.
Current usage metrics show cumulative count of Article Views (full-text article views including HTML views, PDF and ePub downloads, according to the available data) and Abstracts Views on Vision4Press platform.
Data correspond to usage on the plateform after 2015. The current usage metrics is available 48-96 hours after online publication and is updated daily on week days.
Initial download of the metrics may take a while.