Fig. 17
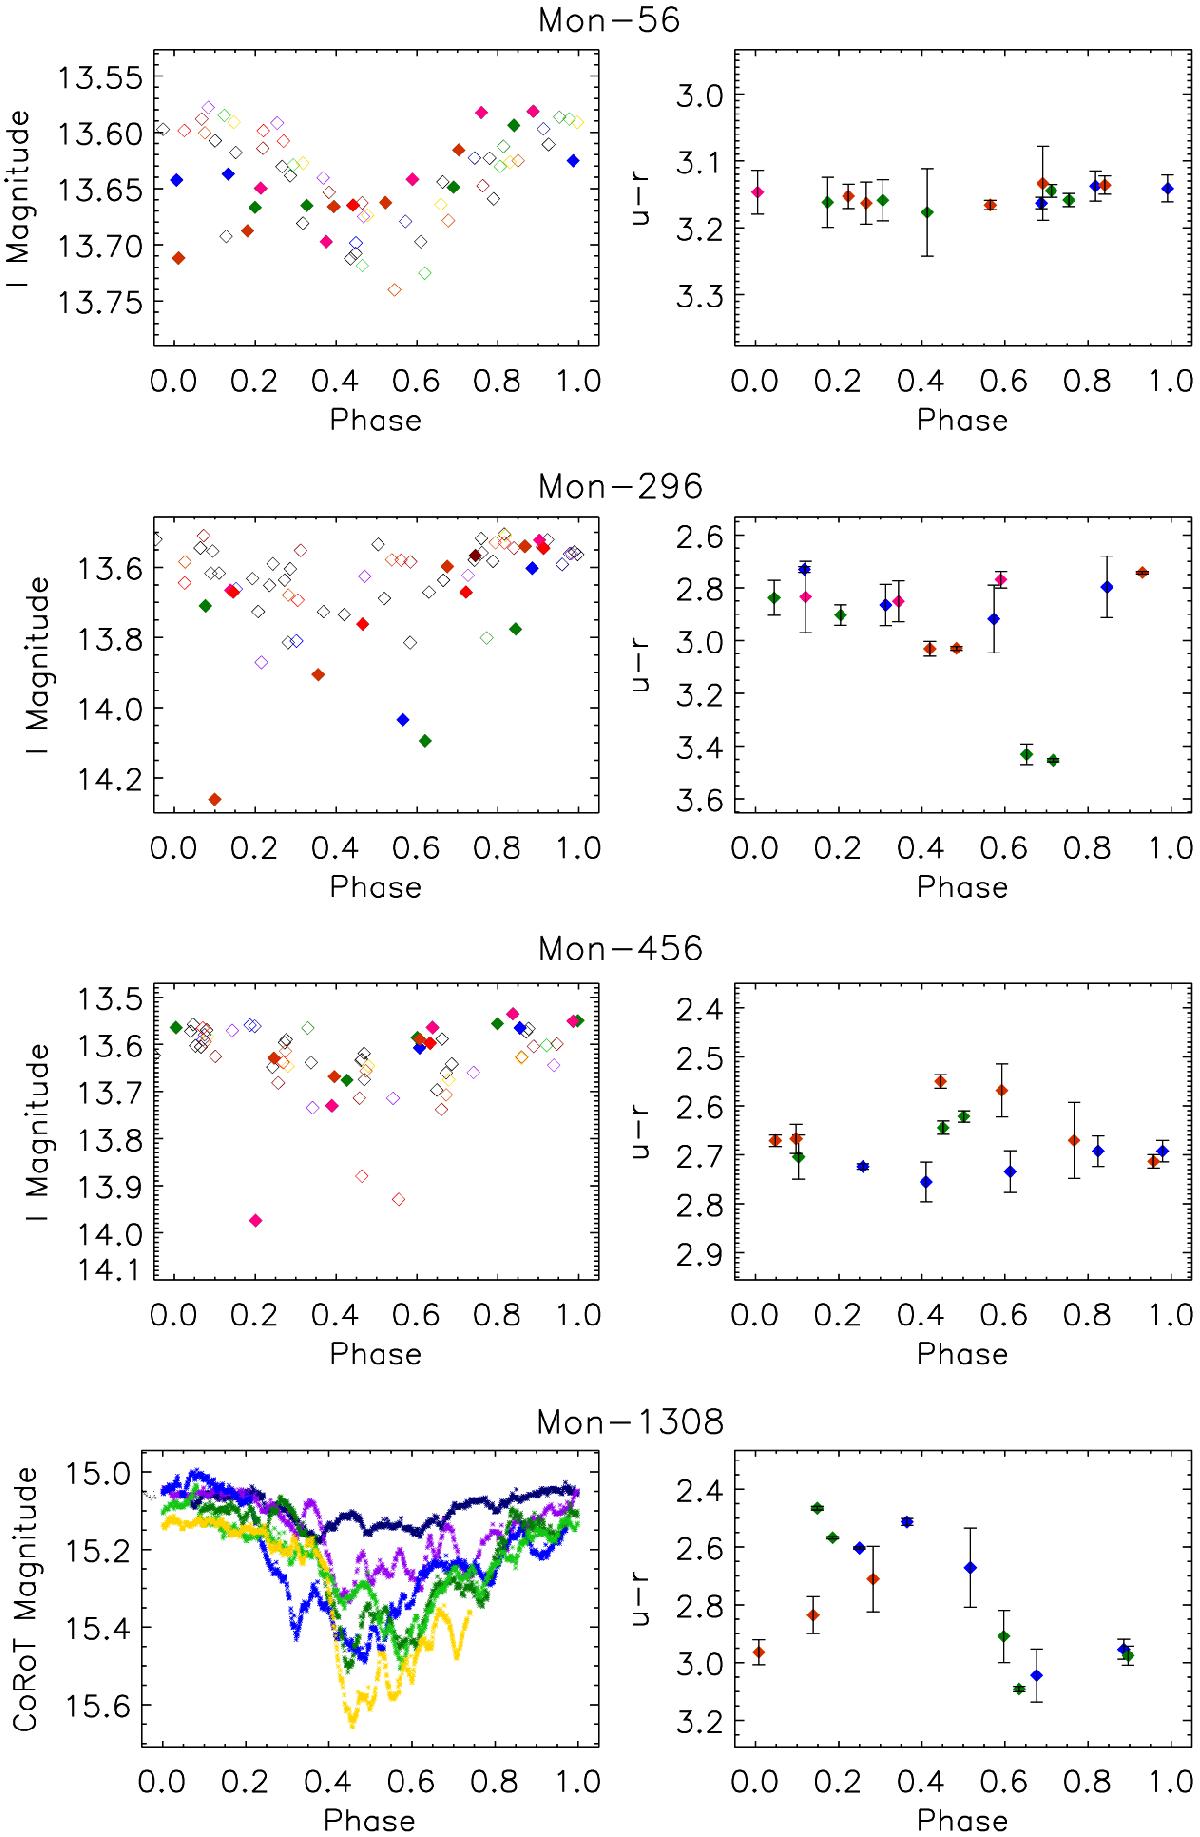
Examples of I-band and u − r light curves folded in phase. The colors used for u − r represent the same rotation cycle as the filled diamonds of the same color in I. Mon-56 shows no measurable variability in u − r; Mon-296 shows reddening events in u − r during its eclipses in the I-band; Mon-456 shows a slight reddening during one of its I-band minima (blue diamonds) and bluing events during the other I-band minima (orange and green diamonds); and Mon-1308 shows a bluing, followed by a reddening event during its minima in the CoRoT light curve. It was not possible to identify flux dips in the phase-folded I-band light curve of Mon-1308 because of insufficient cadence, so the phase-folded CoRoT light curve is shown instead. The same period and initial date were used for CoRoT and u − r, though in this case colors do not represent the same phase in both plots.
Current usage metrics show cumulative count of Article Views (full-text article views including HTML views, PDF and ePub downloads, according to the available data) and Abstracts Views on Vision4Press platform.
Data correspond to usage on the plateform after 2015. The current usage metrics is available 48-96 hours after online publication and is updated daily on week days.
Initial download of the metrics may take a while.