Fig. 6
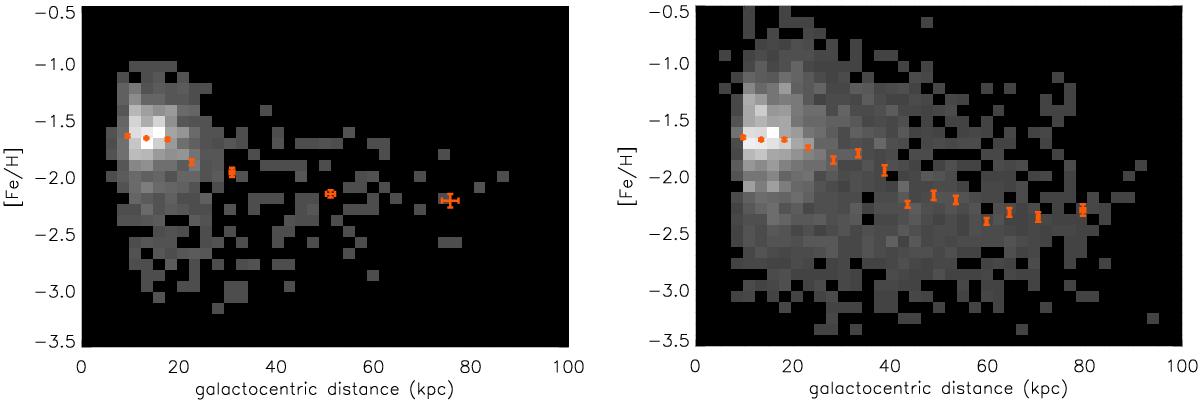
Median [Fe/H] values, as a function of Galactocentric distance, r, shown as a Hess diagram that displays the relative density of stars for each bin of width 0.25 dex in [Fe/H] and 2.5 kpc in distance. The orange points with their error bars summarize the median values of the analyzed set of data with distance. The left panel corresponds to the BOSS F-type spectrophotometric calibration stars, and the right panel to the full SDSS/SEGUE sample (limited to the range described in Sect. 3.1, considering only stars with |Z| > 5 kpc). A clear gradient in [Fe/H], decreasing with distance, is seen for both samples.
Current usage metrics show cumulative count of Article Views (full-text article views including HTML views, PDF and ePub downloads, according to the available data) and Abstracts Views on Vision4Press platform.
Data correspond to usage on the plateform after 2015. The current usage metrics is available 48-96 hours after online publication and is updated daily on week days.
Initial download of the metrics may take a while.