Fig. 4
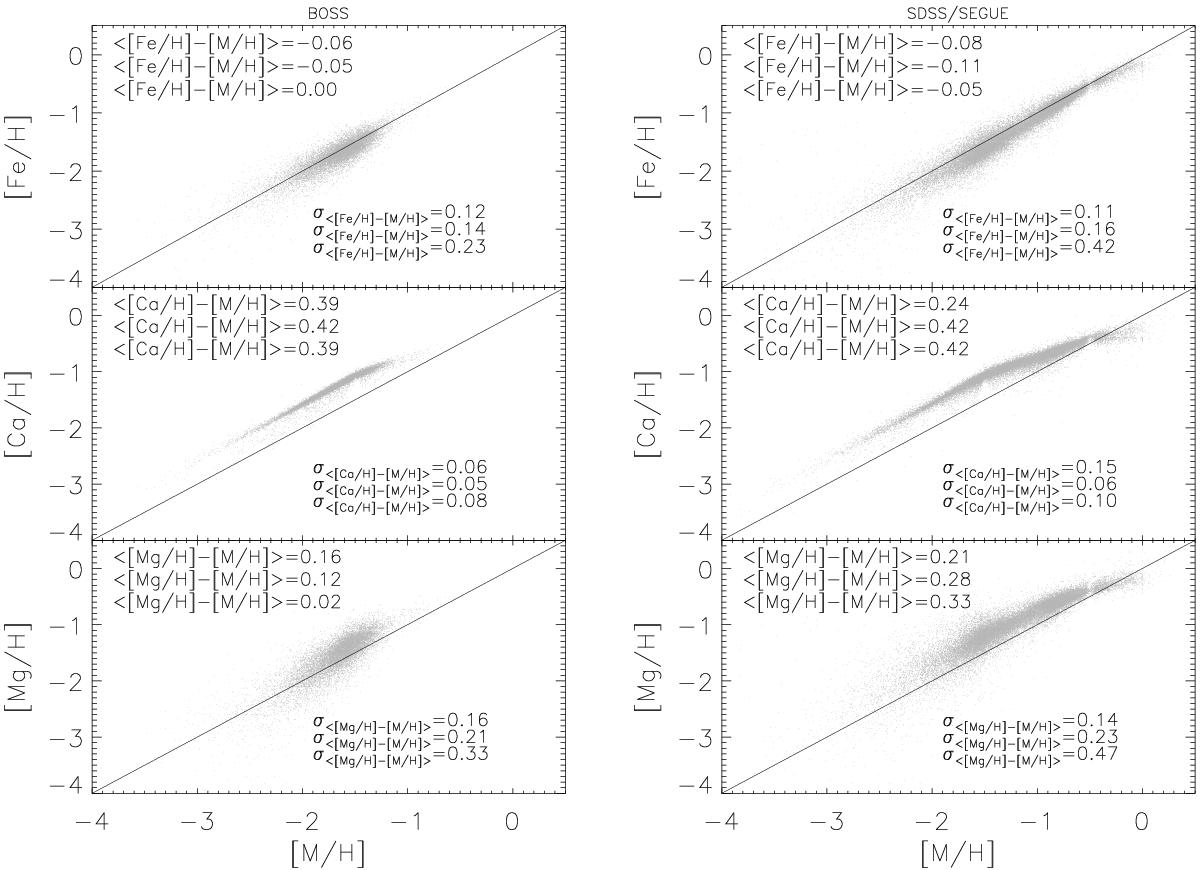
Comparison of the [Fe/H], [Ca/H], and [Mg/H] estimates from SDSS/SEGUE and BOSS stars obtained by fitting individual lines with the metallicity results determined in Paper I, [M/H], which considered the entire spectrum in the analysis. The mean difference between x and y axes appears in the top left corner of each panel, evaluated in three ranges of [M/H]: [M/H] > −1.5, −2 < [M/H] < −1.5, and [M/H] < −2, and the corresponding standard deviations are written in the bottom right corner. The top panels show good agreement between [Fe/H] inferred from individual lines of this element, with an offset of ~0.1 dex. [Ca/H] estimates are offset by ~0.4 dex over [M/H], except at metallicities higher than [M/H] = −1.5, as expected. [Mg/H] estimates display a higher dispersion, increasing with decreasing metallicity, and lower deviations for BOSS stars with respect to SDSS/SEGUE stars.
Current usage metrics show cumulative count of Article Views (full-text article views including HTML views, PDF and ePub downloads, according to the available data) and Abstracts Views on Vision4Press platform.
Data correspond to usage on the plateform after 2015. The current usage metrics is available 48-96 hours after online publication and is updated daily on week days.
Initial download of the metrics may take a while.