Fig. 2
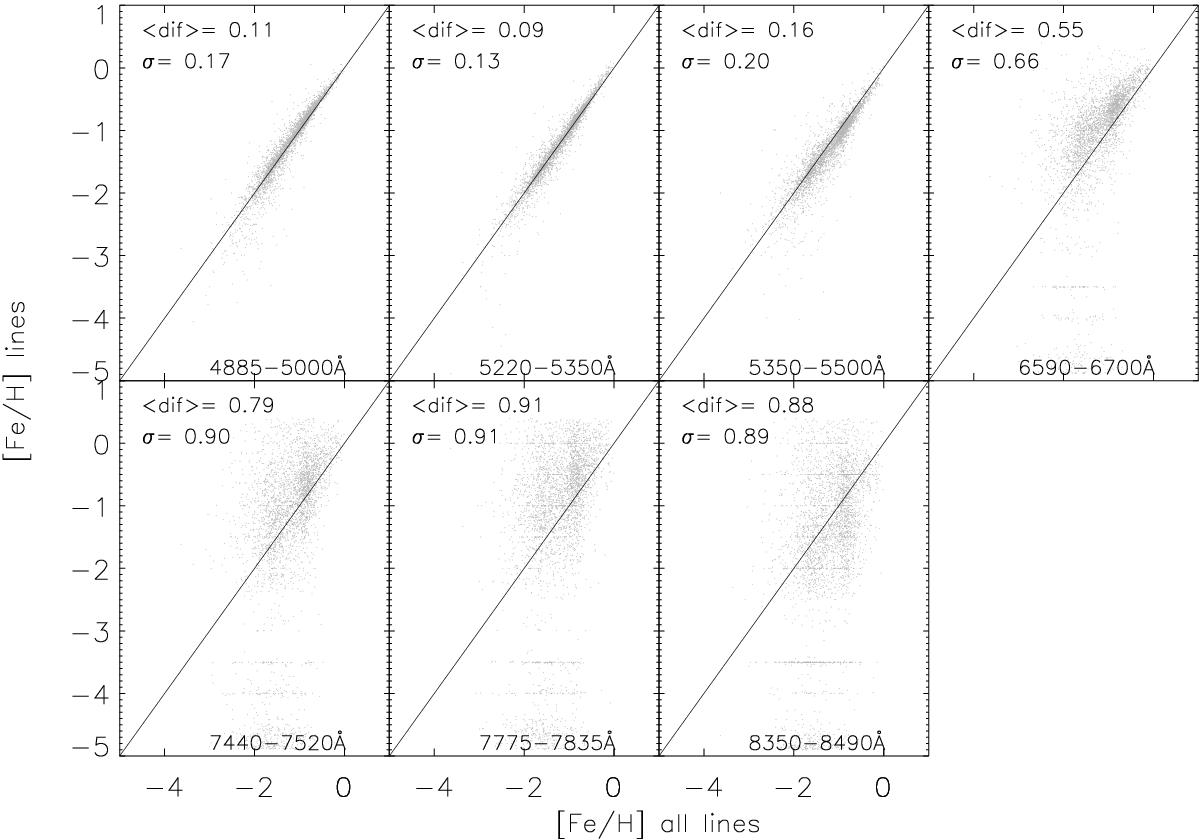
Correlation between the values of [Fe/H] obtained by fitting different spectral regions containing Fe lines, compared with the estimation obtained by fitting all of the selected lines together. The bluest regions best contribute to the determination of [Fe/H], with rms values lower than 0.2 dex. The results of the fitting line for the four reddest regions exhibit little correlation with estimates using all of the regions simultaneously.
Current usage metrics show cumulative count of Article Views (full-text article views including HTML views, PDF and ePub downloads, according to the available data) and Abstracts Views on Vision4Press platform.
Data correspond to usage on the plateform after 2015. The current usage metrics is available 48-96 hours after online publication and is updated daily on week days.
Initial download of the metrics may take a while.