Fig. 8
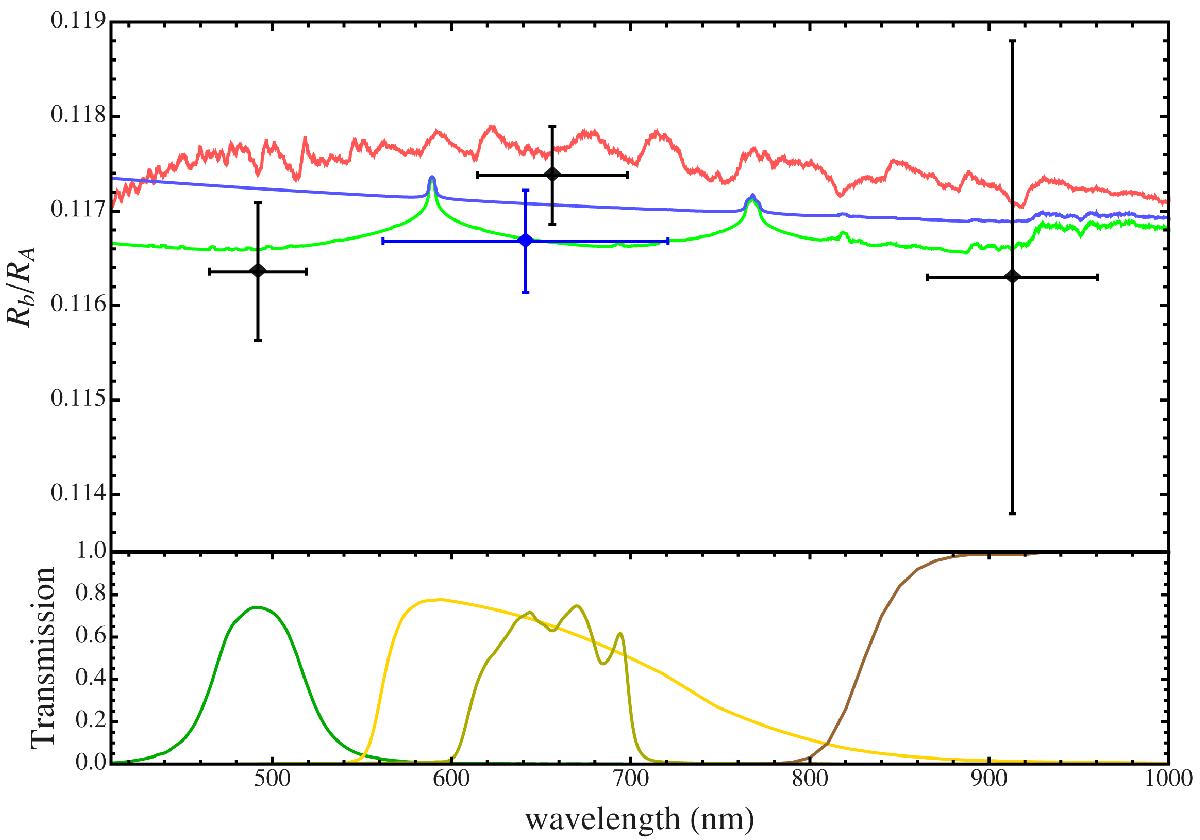
Variation of the planetary radius of HAT-P-23 b, in terms of planet/star radius ratio, with wavelength. The black points are from the transit observed with BUSCA, while the blue point is the weighted-mean results coming from the seven transits observed in Cousins R with the CA 1.23 m telescope. The vertical bars represent the errors in the measurements and the horizontal bars show the FWHM transmission of the passbands used. The observational points are compared with three synthetic spectra for a Jupiter planet with a surface gravity of gb = 25 m s-2 and Teq = 2000 K. The synthetic spectra in green and blue do not include TiO and VO opacity, while the spectrum in red does, based on equilibrium chemistry. With respect to the model identified with the green line, the blue one has H2/He Rayleigh scattering increased by a factor of 100. An offset is applied to all three models to provide the best fit to our radius measurements. Transmission curves of the filters used are shown in the bottom panel.
Current usage metrics show cumulative count of Article Views (full-text article views including HTML views, PDF and ePub downloads, according to the available data) and Abstracts Views on Vision4Press platform.
Data correspond to usage on the plateform after 2015. The current usage metrics is available 48-96 hours after online publication and is updated daily on week days.
Initial download of the metrics may take a while.