Free Access
Fig. 2
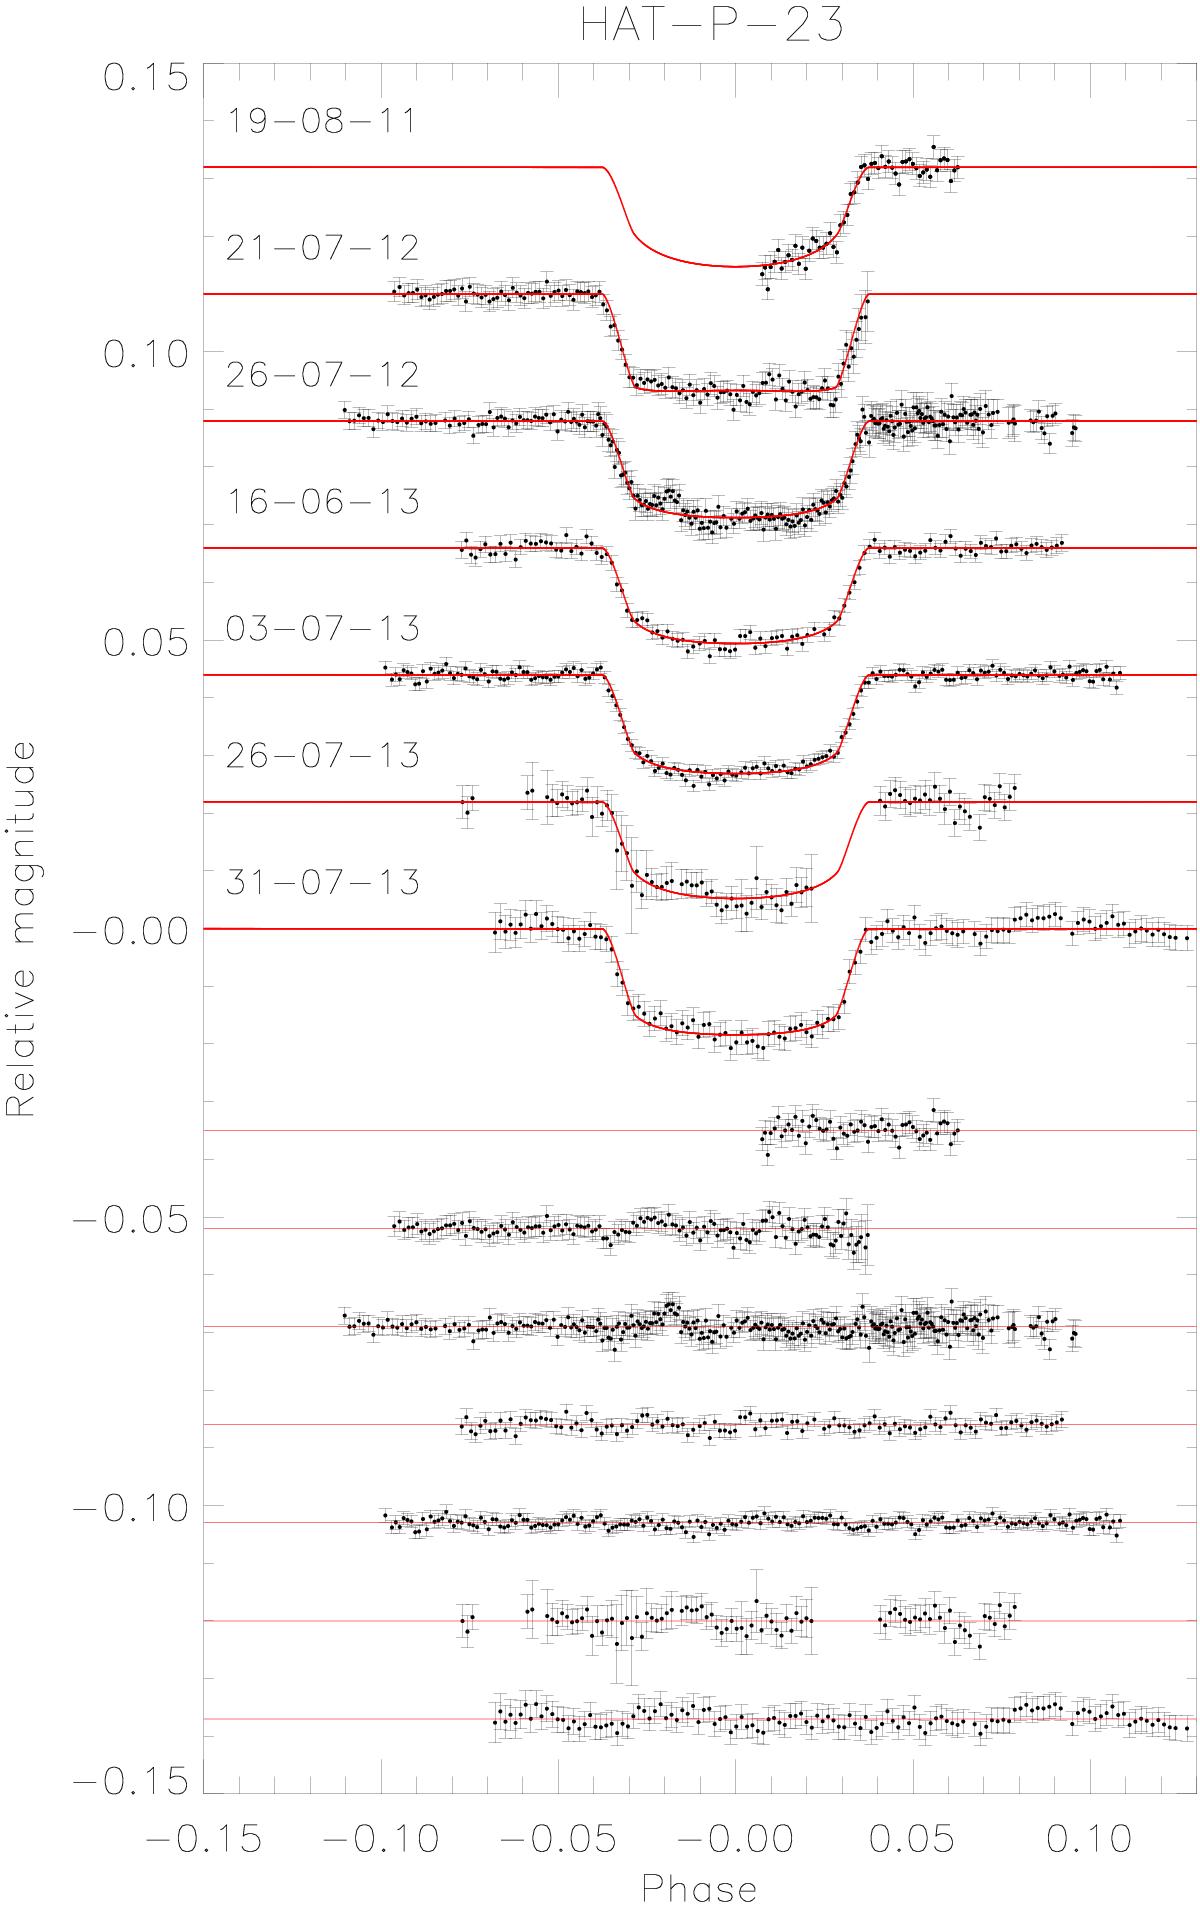
Light curves of transits of HAT-P-23 b, observed with the Calar Alto 1.23 m telescope, compared with the best-fitting models given by jktebop. The date of each observation is given next to the corresponding light curve. The residuals from the fits are shown at the base of the figure in the same order as the light curves.
Current usage metrics show cumulative count of Article Views (full-text article views including HTML views, PDF and ePub downloads, according to the available data) and Abstracts Views on Vision4Press platform.
Data correspond to usage on the plateform after 2015. The current usage metrics is available 48-96 hours after online publication and is updated daily on week days.
Initial download of the metrics may take a while.