Fig. 4
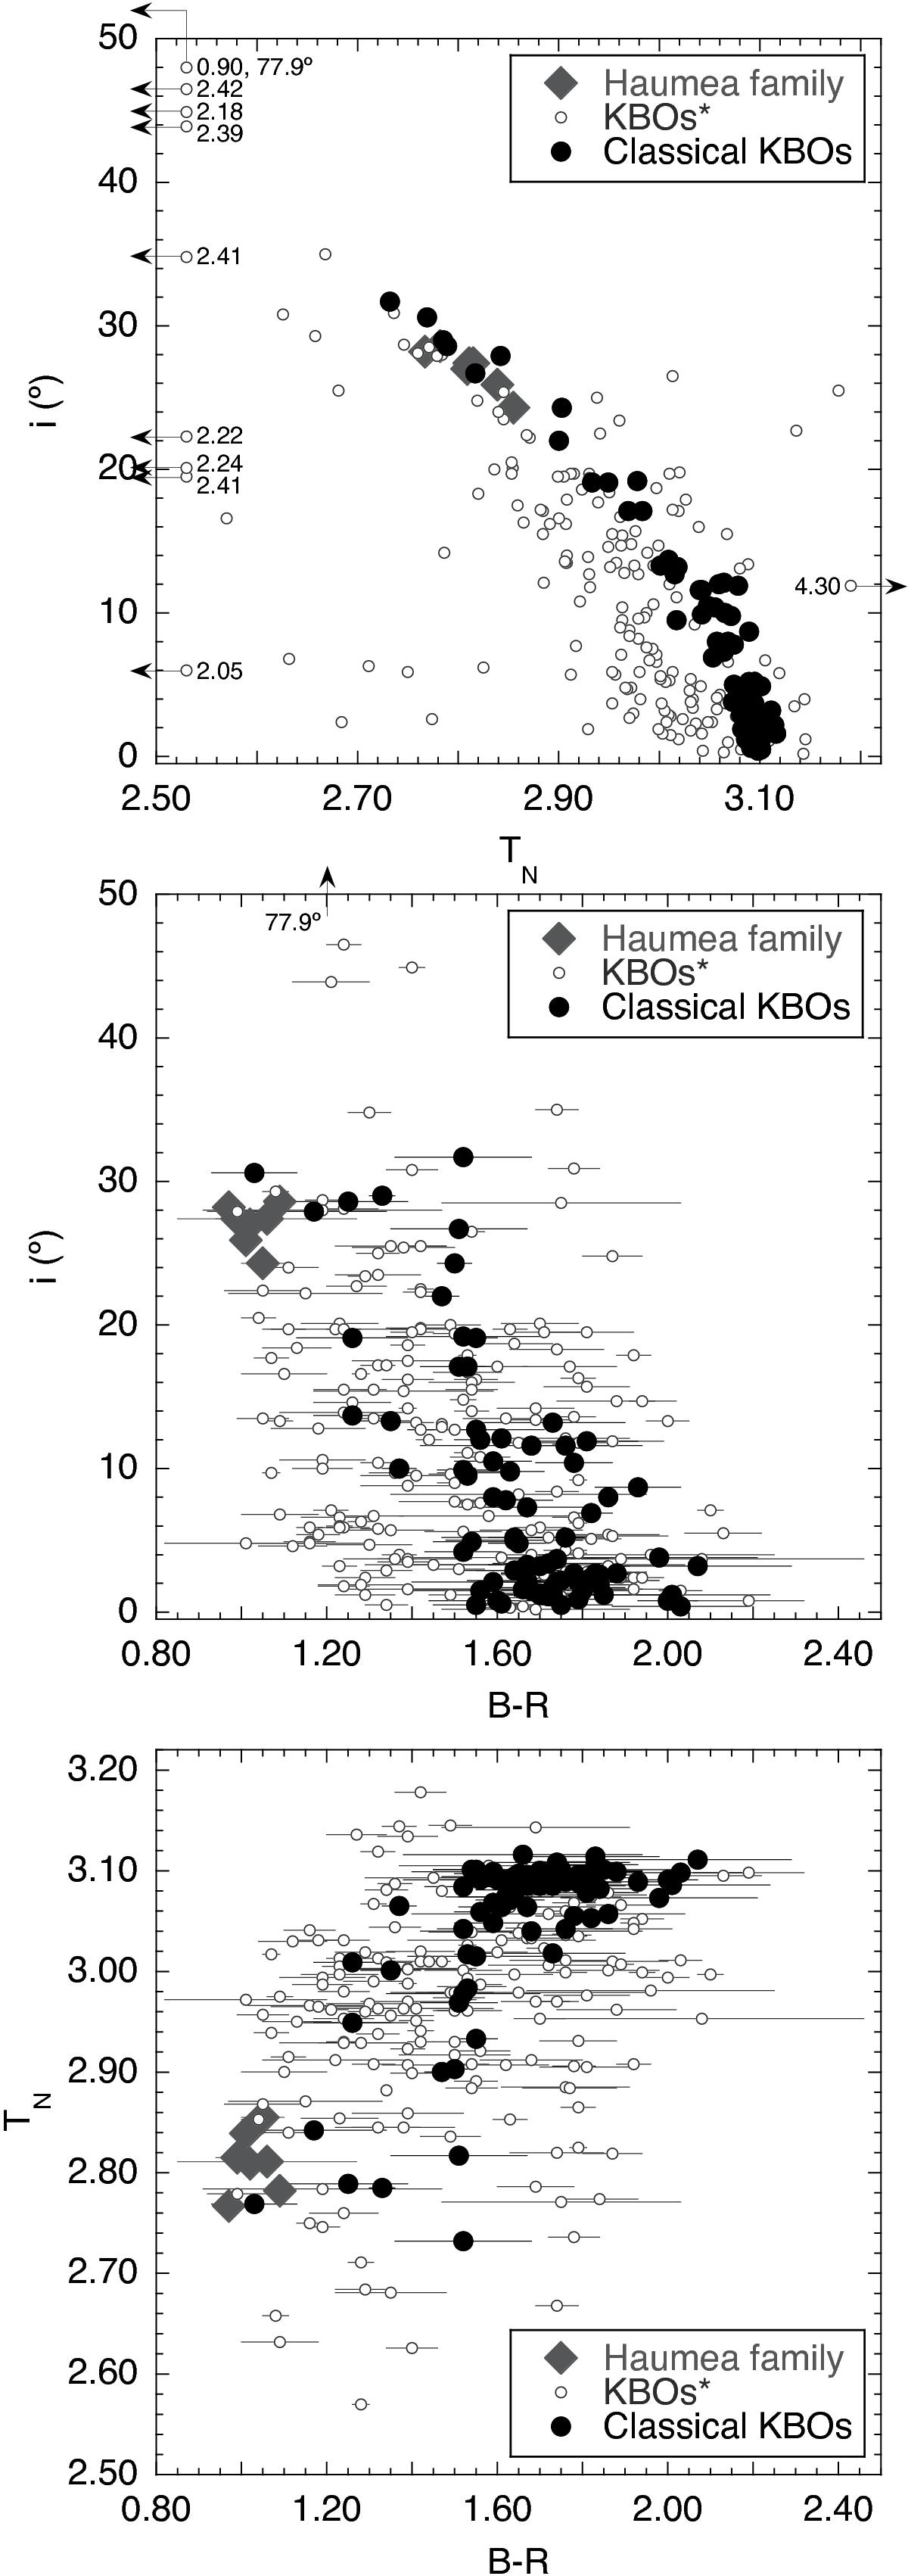
Top: (B − R) vs. orbital inclination plot of CKBOs and all KBOs with indication of Haumea family objects. The correlation for CKBOs alone is stronger than for all KBOs. The clustering of Haumea family objects had a strong effect on this correlation. Middle: Tisserand parameter relative to Neptune (TN) vs. orbital inclination as for the above. TN is very strongly correlated with i for CKBOs. Bottom: (B − R) vs. TN as for the above. Given the very strong link between TN and i, statistically one cannot know if only TN or i have a (potentially) physically meaningful relation with (B − R) but none dominates the other.
Current usage metrics show cumulative count of Article Views (full-text article views including HTML views, PDF and ePub downloads, according to the available data) and Abstracts Views on Vision4Press platform.
Data correspond to usage on the plateform after 2015. The current usage metrics is available 48-96 hours after online publication and is updated daily on week days.
Initial download of the metrics may take a while.