Fig. 2
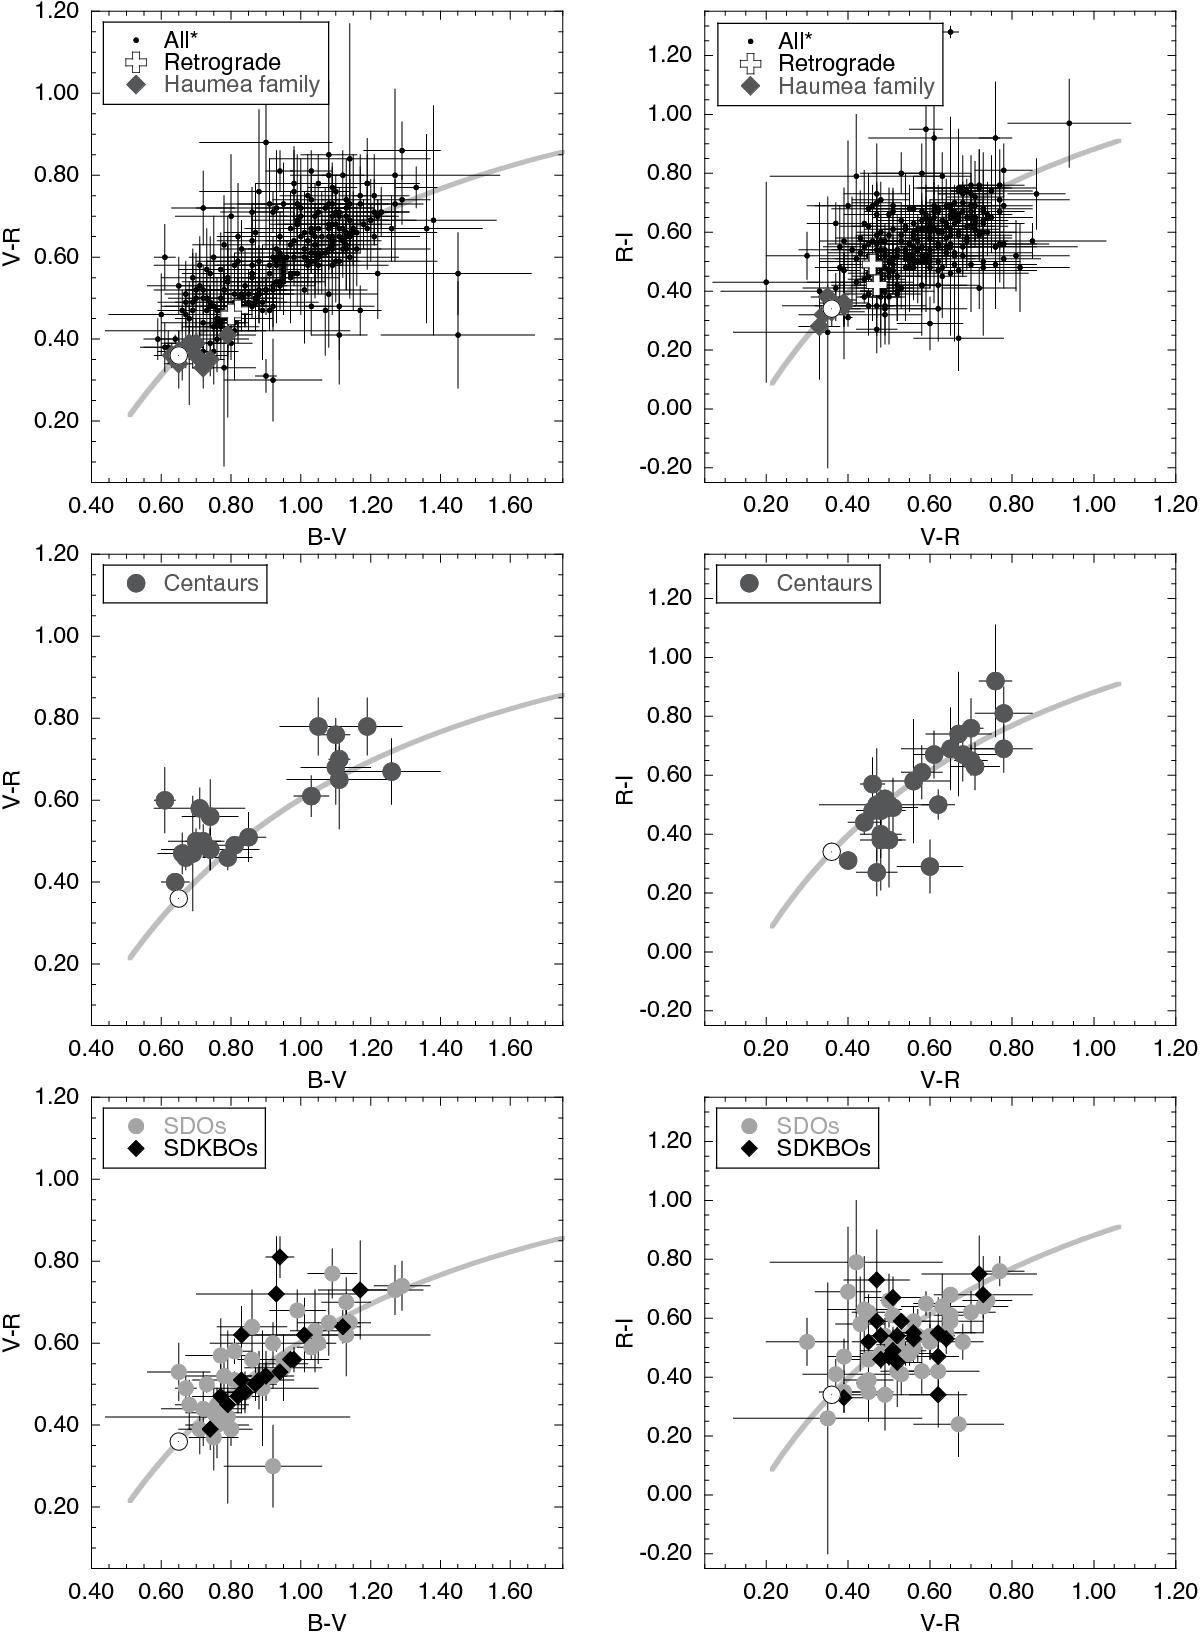
(B − V) vs. (V − R) plots −left column − and (V − R) vs. (R − I) plots −right column − including the reddening line. Solar colors are indicated with the ⊙ symbol. Top panels: all objects, Haumea family objects, and retrograde objects. Middle panels: Centaurs. Bottom panels: scattered disk objects (SDOs), and scattered or detached Kuiper belt objects (SDKBOs). The stronger correlation between (B − V) and (V − R) colors than between (V − R) and (R − I) is clear. Apart from the solar-like colors of Haumea family objects and the two color groups of Centaurs in the (B − V) vs. (V − R) there is no apparent relevant difference between the color distribution of each family of objects.
Current usage metrics show cumulative count of Article Views (full-text article views including HTML views, PDF and ePub downloads, according to the available data) and Abstracts Views on Vision4Press platform.
Data correspond to usage on the plateform after 2015. The current usage metrics is available 48-96 hours after online publication and is updated daily on week days.
Initial download of the metrics may take a while.