Free Access
Fig. 11
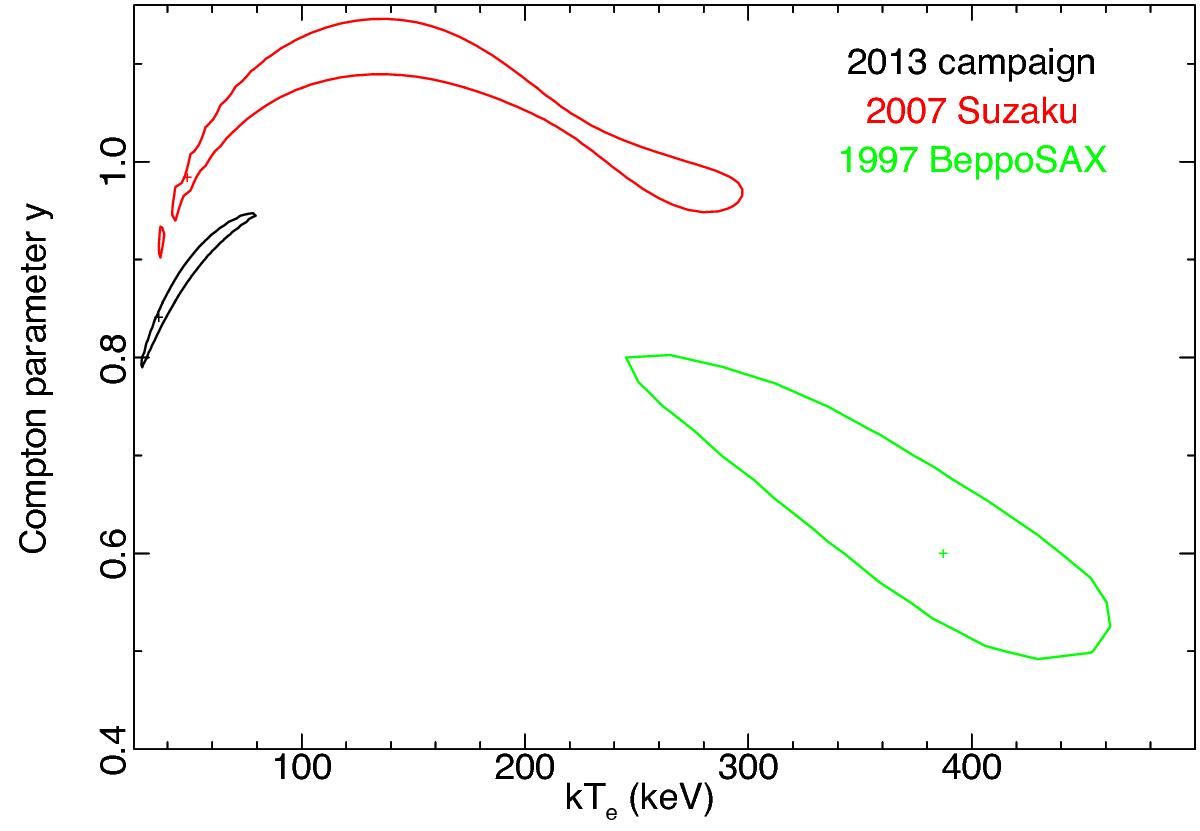
kTe − y 90% confidence level contours for the spectra fitted with compps, using spherical geometry. Black: average spectrum of the 2013 campaign; red: average spectrum of the seven Suzaku observations taken in 2007; green: BeppoSAX observation taken in 1997.
Current usage metrics show cumulative count of Article Views (full-text article views including HTML views, PDF and ePub downloads, according to the available data) and Abstracts Views on Vision4Press platform.
Data correspond to usage on the plateform after 2015. The current usage metrics is available 48-96 hours after online publication and is updated daily on week days.
Initial download of the metrics may take a while.