Fig. 1
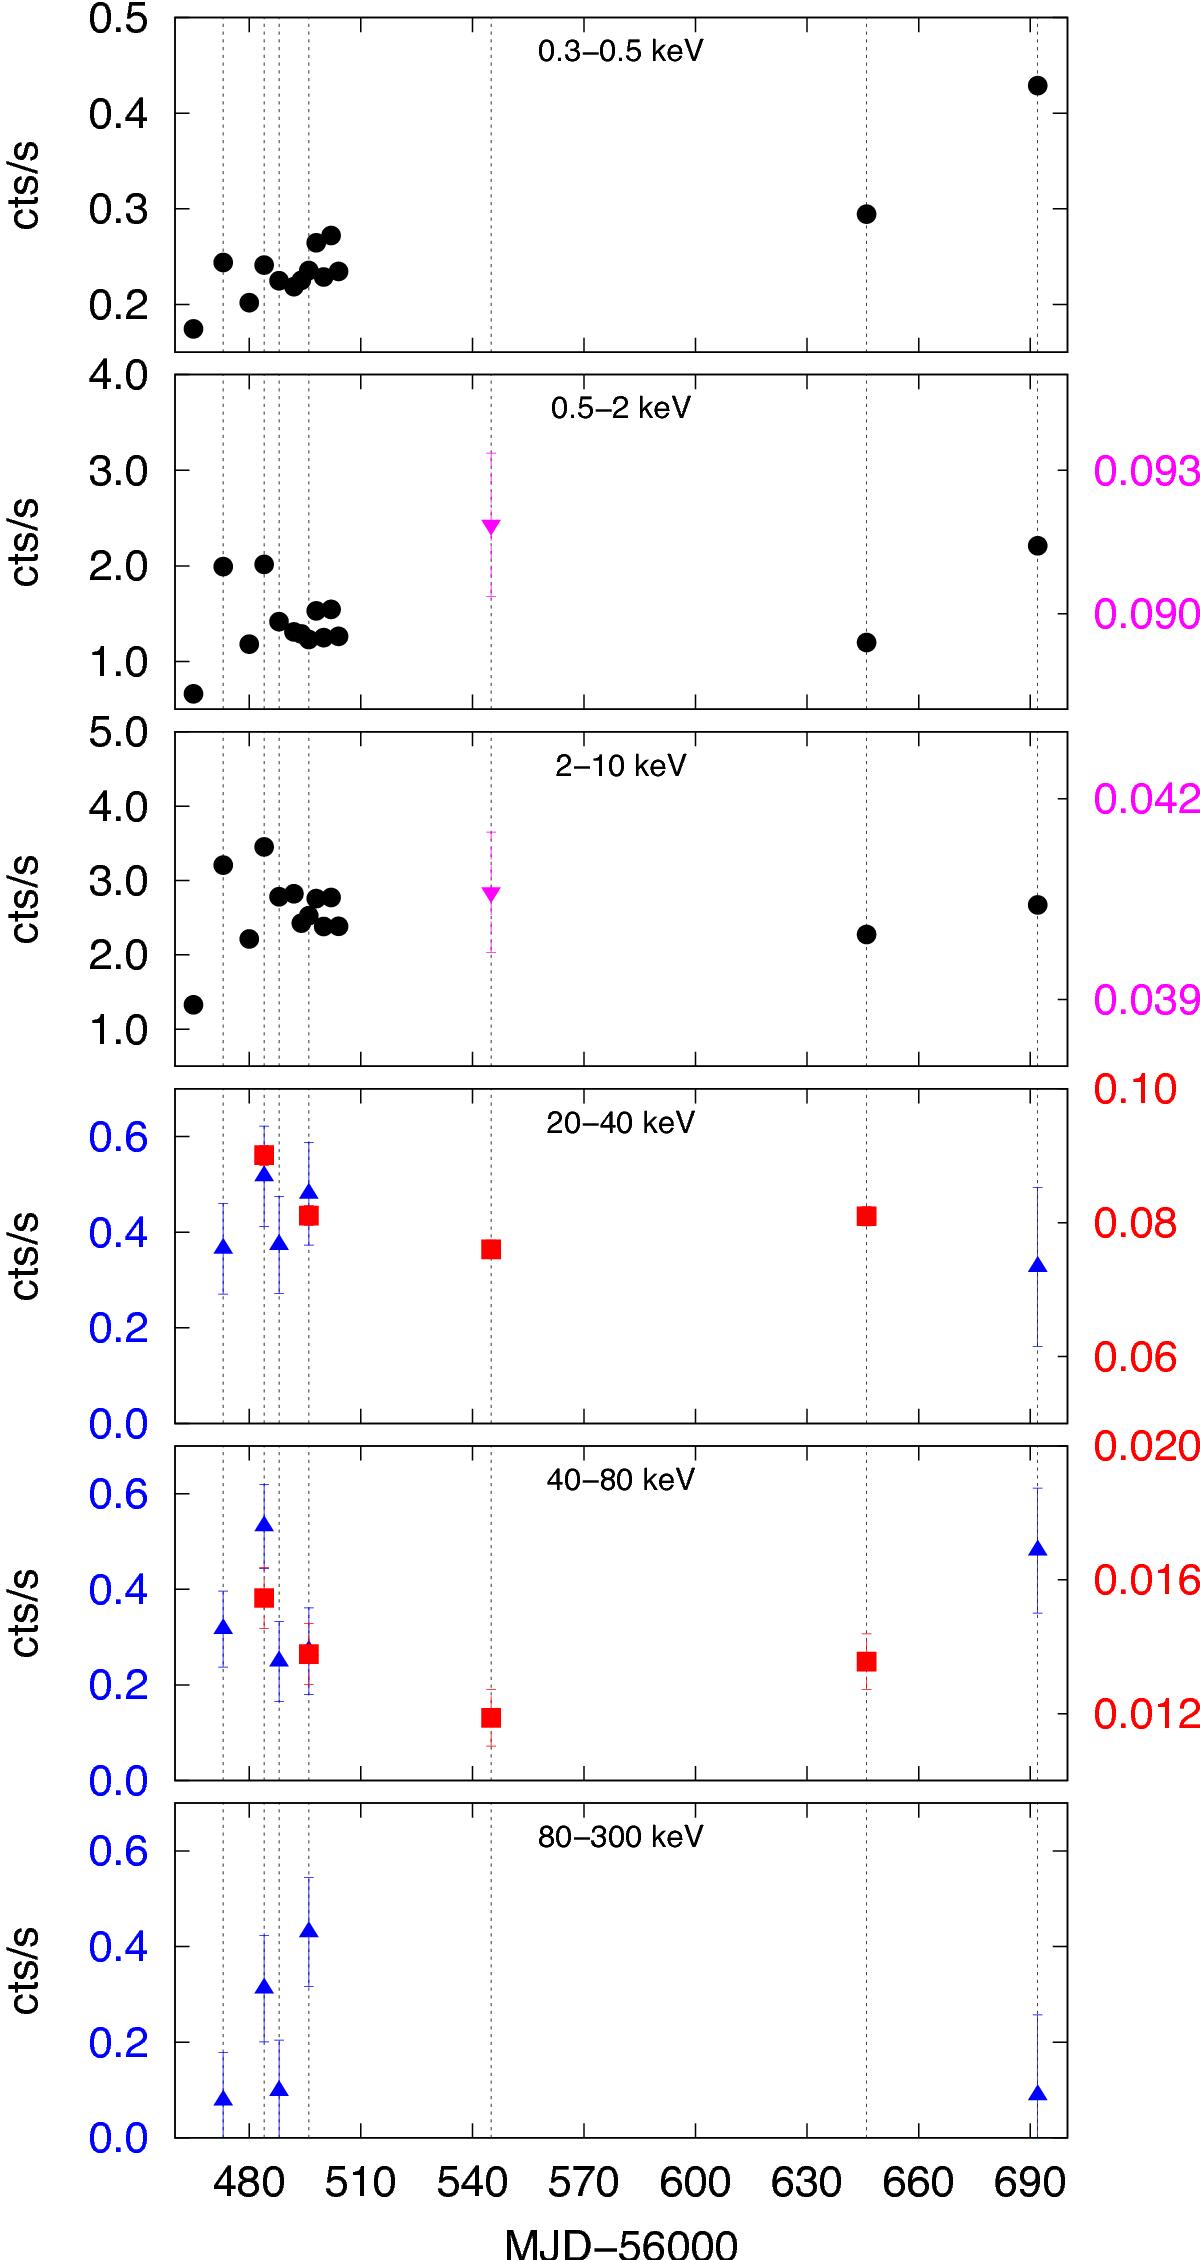
Light curves in different energy ranges. On the x-axis, we report the last three digits of the Modified Julian Date. On the y-axis, on both left and right side, we report the count-rate. Black circles: XMM-Newton (0.3–0.5 keV, 0.5–2 keV, 2–10 keV); magenta nablas: Chandra (0.5–2 keV, 2–10 keV); red squares: NuSTAR (20–40 keV, 40–80 keV); blue triangles: INTEGRAL (20–40 keV, 40–80 keV, 80–300 keV). The vertical dotted lines highlight the seven observations we analysed in this paper (i.e., those including NuSTAR and/or INTEGRAL data).
Current usage metrics show cumulative count of Article Views (full-text article views including HTML views, PDF and ePub downloads, according to the available data) and Abstracts Views on Vision4Press platform.
Data correspond to usage on the plateform after 2015. The current usage metrics is available 48-96 hours after online publication and is updated daily on week days.
Initial download of the metrics may take a while.