Fig. 9
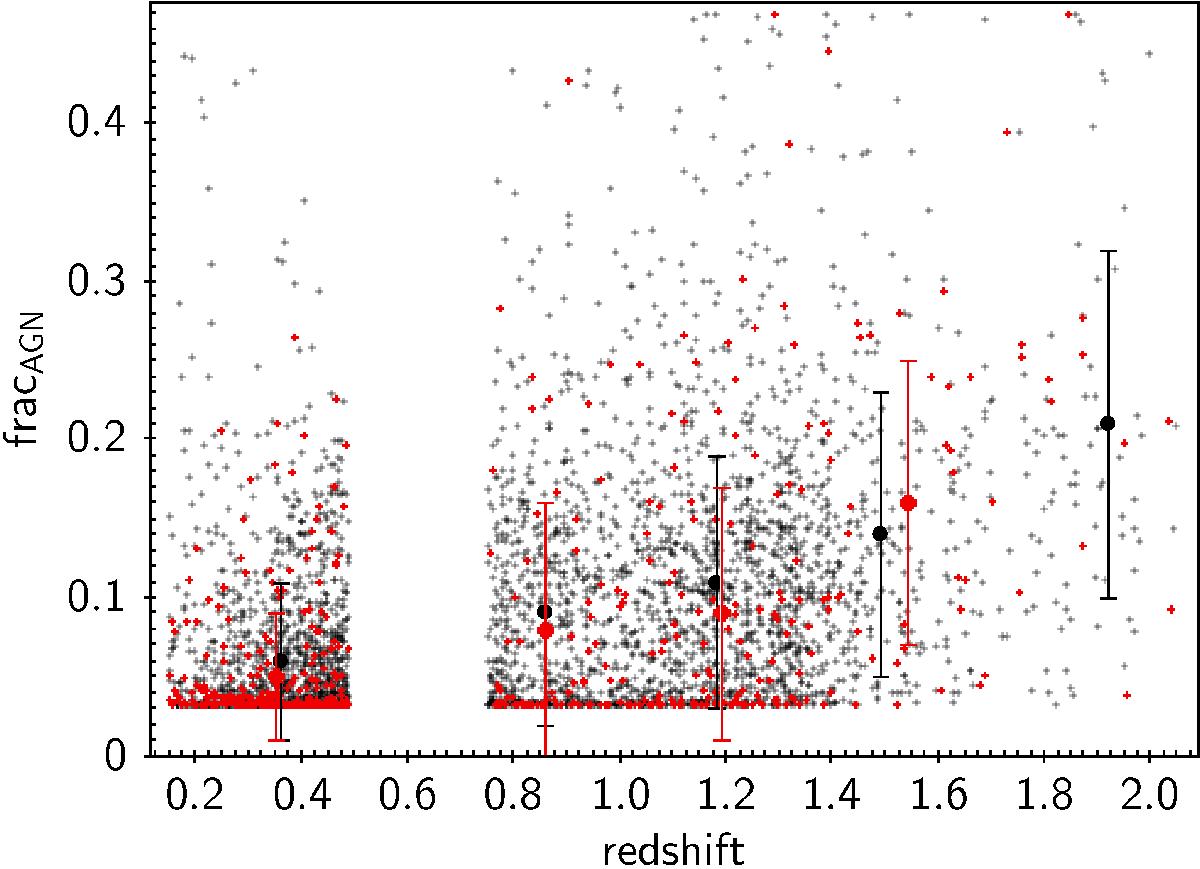
AGN fractions measured with CIGALE plotted versus the redshift of the sources: the whole sample is plotted with grey points, the measures for galaxies detected with PACS are represented with red points. The average values and dispersion for each redshift bin are over plotted (black filled circles for the whole sample, red filled circles for the PACS detections). The AGN fractions are always larger than 0 since they are measured as the mean of the PDF. The last redshift bin is not considered for the PACS detections since it contains only 7 sources.
Current usage metrics show cumulative count of Article Views (full-text article views including HTML views, PDF and ePub downloads, according to the available data) and Abstracts Views on Vision4Press platform.
Data correspond to usage on the plateform after 2015. The current usage metrics is available 48-96 hours after online publication and is updated daily on week days.
Initial download of the metrics may take a while.