Fig. 8
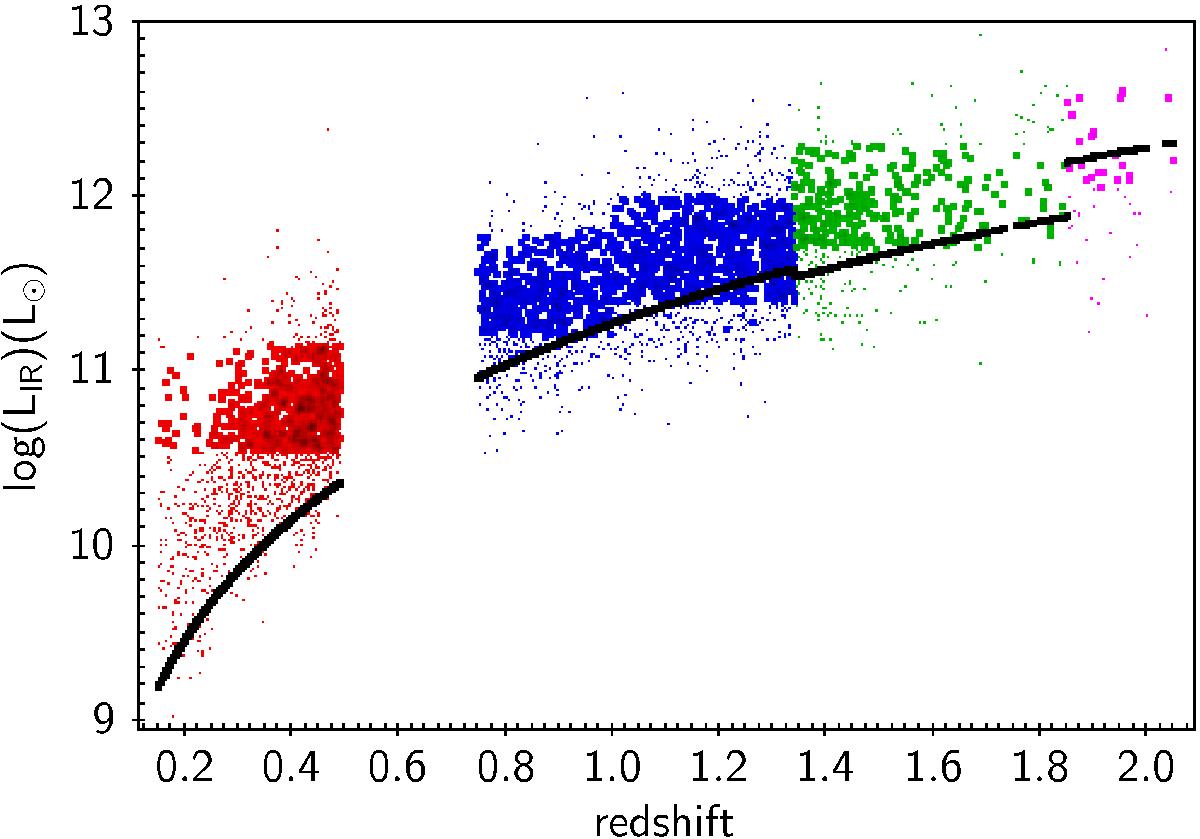
Redshift and luminosity distributions of the sources. The total IR luminosity LIR, plotted on the y-axis, is an output of the SED fitting. The small dots represent the whole sample and the filled circles the subsample of galaxies selected around ![]() within each redsfhift bin (bin 1: red; bin 2: blue, split in two subbins corresponding to z< 1 and z> 1; bin 3: green; bin 4: magenta). The adopted values of
within each redsfhift bin (bin 1: red; bin 2: blue, split in two subbins corresponding to z< 1 and z> 1; bin 3: green; bin 4: magenta). The adopted values of ![]() 10.84 (bin 1), 11.5 (bin 2, z< 1), 11.7 (bin 2, z> 1), 12 (bin 3), and 12.35 (bin 4). The bin size in luminosity is 0.6 dex. Detection limits at 5σ are reported as a black line.
10.84 (bin 1), 11.5 (bin 2, z< 1), 11.7 (bin 2, z> 1), 12 (bin 3), and 12.35 (bin 4). The bin size in luminosity is 0.6 dex. Detection limits at 5σ are reported as a black line.
Current usage metrics show cumulative count of Article Views (full-text article views including HTML views, PDF and ePub downloads, according to the available data) and Abstracts Views on Vision4Press platform.
Data correspond to usage on the plateform after 2015. The current usage metrics is available 48-96 hours after online publication and is updated daily on week days.
Initial download of the metrics may take a while.